
How To Create A Sales Report: The Only Guide You Need in 2026

Dmytro Chervonyi
CMO at Forecastio

Sales reporting in the B2B landscape is more than just compiling numbers—it’s a key strategy for driving revenue growth and achieving scalable success. As we move into 2024, sales leaders must leverage data-driven reports to outpace competitors and sustain consistent B2B growth. This guide will equip you with actionable insights on how to create a sales report that unlocks potential, boosts your team’s efficiency, and delivers predictable business results.
Creating effective reports depends on your cadence and objectives. Understanding how to create a monthly sales report helps businesses identify long-term performance trends, assess recurring revenue, and refine quarterly targets. Meanwhile, learning how to create a weekly sales report enables sales leaders to monitor short-term pipeline health, track rep activity, and quickly address performance gaps. Tools like Forecastio, built natively for HubSpot, simplify this process by automating report generation and providing AI-powered insights that ensure 95% forecast accuracy.
With Forecastio, sales leaders can move beyond manual spreadsheets and build dynamic, real-time reports that align with both strategic goals and day-to-day execution. The platform’s intuitive dashboards and quick implementation make it easy to visualize sales performance across any timeframe—weekly, monthly, or quarterly—empowering teams to make smarter, faster decisions that drive predictable revenue growth.
What is a sales report
Definition and purpose of a sales report
A sales report is a document that summarizes a company’s sales activities and results over a set period. Think of it as a snapshot of your sales performance, with key sales metrics and trends to inform your decisions. The purpose of a sales report is to give you a clear and concise view of sales metrics so you can track progress, and see where to improve and optimize your sales strategies. Whether it’s a monthly sales report, weekly sales report, or detailed sales analysis report these documents are the tools to measure sales performance and make data-driven decisions.
Sales reports do:
Performance measurement: So you can measure your sales team against targets.
Trend analysis: By looking at your data over time you can see what’s emerging and adjust your approach.
Strategic planning: Sales reports give you the insights to refine your sales strategy and resource allocation.
In short, a good sales report is not just a record of past activity but a tool to drive future success.
Sales reports in business decision-making
Sales reports are essential in business decision-making. They give you accurate and up-to-date data that can impact your strategic choices. By digging into sales data businesses can see where to improve, optimize their sales strategy, and make informed decisions on resource allocation. For example, if your sales report shows a dip in sales in a particular region you can investigate further and take action – provide more training to your sales reps or adjust your marketing efforts.
Plus sales reports are the key to measuring your sales teams. You can see who your top performers are and what sets them apart and use that to coach and develop the rest of your team. Sales reports also give you a view into customer behavior and preferences so you can tailor your sales approach to meet their needs.
In short sales reports are not just about numbers; they are about getting actionable insights that will drive your business. By using the data in these reports you can make smarter more strategic decisions that will grow your business and your sales.

Making sales reporting work
Imagine having a crystal ball that could show you the state of your sales pipeline, your team’s performance, and your future revenue. That’s what a good sales report gives you. It’s more than just numbers on a page – it’s the compass that guides your sales strategy and the fuel for your decision-making engine. The sales reporting process is key to making sales reports work by breaking it down into steps, setting clear objectives, and using CRM tools to automate data analysis and report building.
For sales leaders, these reports give real-time visibility into key metrics such as revenue growth, sales cycle length, win rates, and pipeline velocity. They help you see emerging trends, opportunities and resource allocation. Most importantly they enable you to make quick decisions that can pivot your strategy and drive results.
Overcoming reporting challenges
Despite the benefits, many organizations struggle with sales reporting. You may find your data is scattered across multiple platforms so you can’t get a full view. Or you may be drowning in numbers but starving for insights and can’t see the wood for the trees. Your team may be spending more time building reports than selling or worse your decision-making is being delayed because you can’t get real-time data.
These are common but not impossible to overcome. With the right approach and tools, you can turn sales reporting into a strategic asset not a time-consuming task. Using a sales report template can help you speed up the process and present sales data and track performance across different timeframes.
Gathering and organizing sales data
Collecting and managing data is the foundation of creating sales reports. Without accurate and organized data your reports will lack the insights to drive action. Here are some best practices to ensure your sales data is both reliable and actionable:
Use a CRM system: A CRM system is the hub for collecting and storing sales data. It consolidates all your sales information so you can track interactions, manage leads, and monitor sales activity.
Ensure data accuracy and completeness: Implement data validation and verification processes to ensure the data you collect is accurate and complete. This may involve regular audits, automated checks and manual reviews to catch any discrepancies.
Use sales analytics tools: Use sales analytics tools like Forecastio to analyze and visualize your sales data. These tools will help you see patterns and trends that aren’t visible from the raw data.
Schedule data collection: Consistency is key. Schedule regular data collection and reporting. Whether it’s daily, weekly, or monthly having a routine ensures your data is up to date and ready to be analyzed. Forecastio analyze sales data for you, and signal if it looks not accurate.
See trends and patterns: Use your data to see trends and patterns in sales performance. This will help you understand what’s working and what’s not so you can make informed decisions.
Inform sales strategies: Finally use the insights from your data to inform your sales strategies. Whether it’s optimizing your sales process, reallocating resources or refining your approach to customer engagement data-driven decisions will give you better results.
By following these best practices you’ll ensure your data is both accurate and a powerful tool to drive your sales performance and business goals.
Essential monthly sales reports
To get a full view of your sales performance you need a range of reports in your toolkit. Here are the key sales reports every sales leader should have at their disposal:
Monthly sales report: This is your high-level view, showing total revenue, new customers acquired, top-performing products, and how you’re tracking against your goals. It’s your monthly health check, giving you a quick snapshot of your sales performance.
Sales pipeline report: Think of this as your sales forecast radar. It shows you the number and value of deals at each stage of your sales funnel, so you can predict future revenue and see any blockages in your sales.
Sales activity report: This sales report is all about measuring hustle. It tracks key activities like calls made, emails sent, and meetings scheduled. Use it to make sure your team is putting in the effort where it matters.
Customer churn report: In B2B sales retaining customers is just as important as acquiring new ones. This sales report helps you keep an eye on customer attrition rates and see patterns so you can improve retention strategies.
Sales performance report: Who are your top performers and why are they winning? This sales report breaks down individual and team performance metrics so you can see best practices and areas to coach. Analyze data by a sales rep to see individual performance, customer behavior and the effectiveness of sales strategies.
Sales pipeline report
A sales report focused on the pipeline gives a structured overview of all active opportunities and their movement across stages. It is one of the most important documents in monthly sales reporting because it connects current activity with future revenue.
A strong pipeline sales report should not only show total pipeline value. It should explain pipeline quality, progression, and risk.
What a sales pipeline report should include:
1. Pipeline snapshot for the current period
Start with a clear summary:
Total pipeline value
Number of active opportunities
Average deal size
Weighted pipeline value
Coverage ratio vs quota
This gives leadership an immediate view of revenue potential.
To make this report meaningful, always compare it to a similar previous period. For example, compare this month to the same month last quarter. This comparison reveals whether pipeline growth is stable, seasonal, or declining.
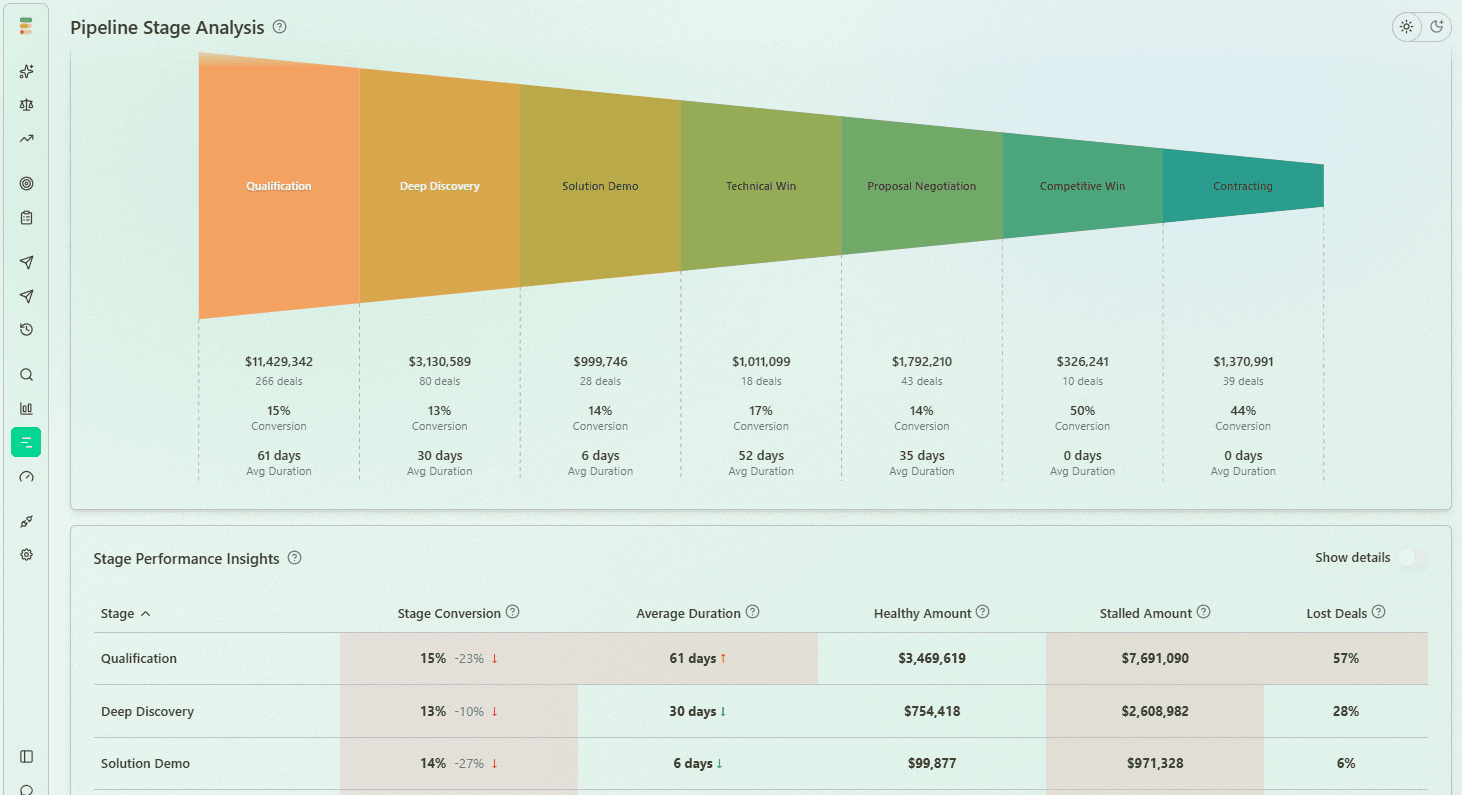
2. Pipeline stage distribution
Every sales pipeline report should show how deals are distributed across stages.
Include:
Number of deals per stage
Value per stage
Stage-to-stage conversion rates
Average time in stage
This part of sales pipeline analysis helps identify bottlenecks. If too many deals are stuck in one stage, it signals issues in qualification, value communication, or stakeholder alignment.
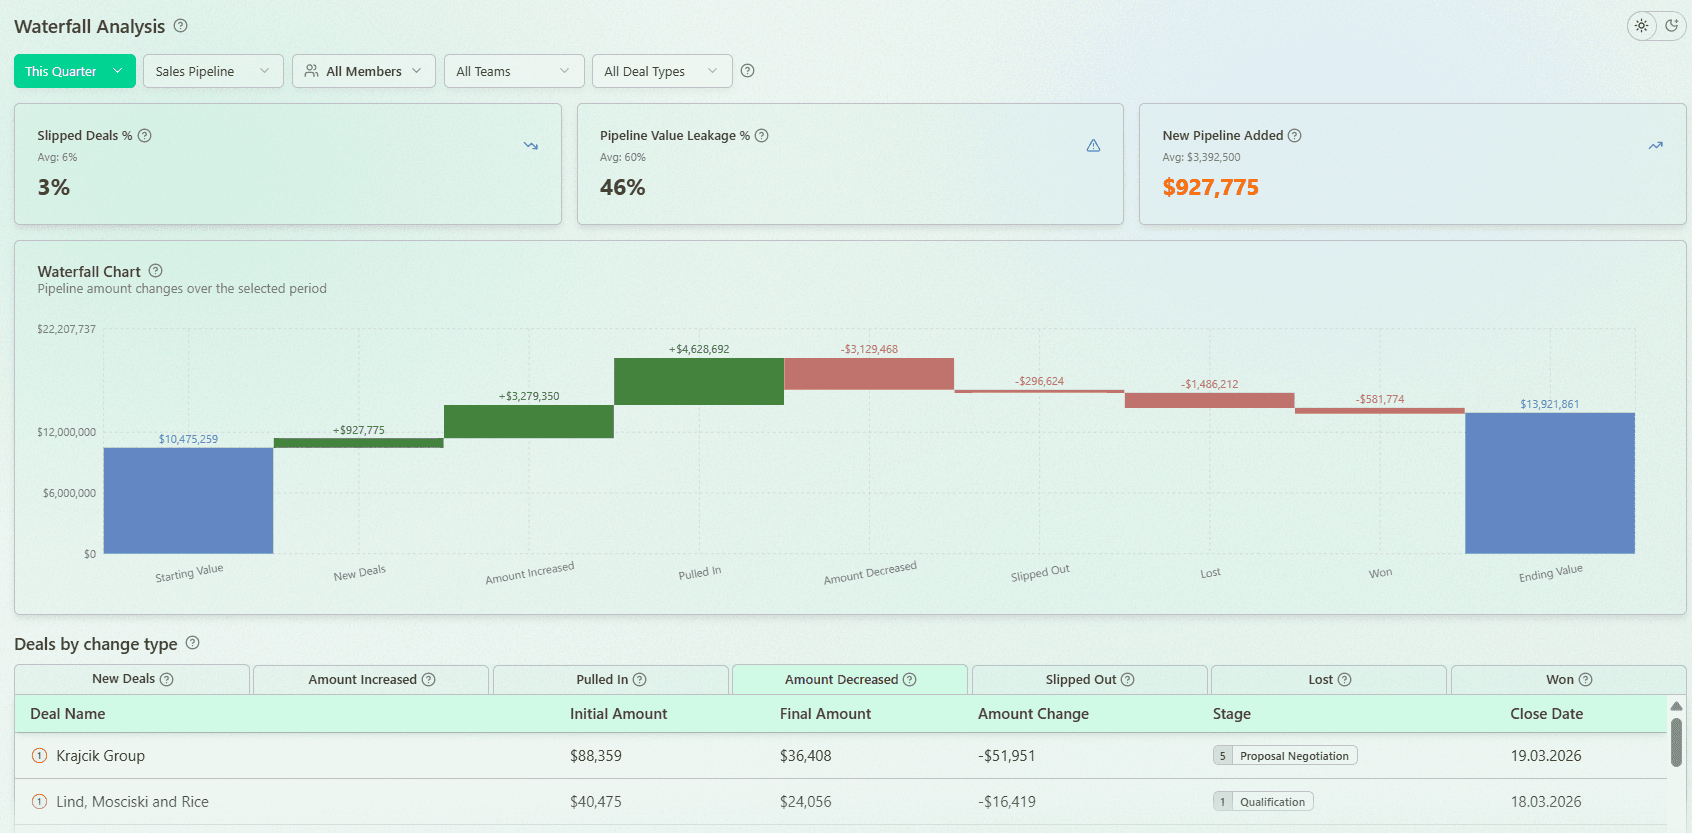
3. Pipeline waterfall analysis
A waterfall view explains how the pipeline changed during the period.
It should include:
Pipeline at the beginning of the period
New opportunities added
Deals closed won
Deals closed lost
Pipeline at the end of the period
This analysis shows how effectively the team generates new opportunities and converts existing ones. It also helps leadership understand whether growth comes from new pipeline or from pushing existing deals forward.
Waterfall analysis is essential for structured sales pipeline management because it explains movement, not just static numbers.
Pipeline Waterfall Analysis in Forecastio:
4. Pipeline health and risk indicators
A modern sales report should also include pipeline health signals:
Deals with close date slippage
Stalled opportunities
Aging deals
Late-stage opportunities without clear next steps
This makes sales reporting actionable. Instead of simply showing numbers, it highlights areas that require intervention.
Building your sales report: A how-to guide
Now you know the importance and types of sales reports, let’s get into how to create them.
Step 1: Set your goals
Before you start collecting data, get clear on what you want to achieve from analyzing your company’s sales performance. Are you looking to identify your most profitable products? Why has your win rate dropped? Or maybe you’re trying to forecast next quarter’s revenue? Your goals will determine what data you collect and how you present it.
Step 2: Pick your metrics
With your goals in mind, select the metrics that matter. While revenue growth and win rate are important for everyone, don’t forget metrics like sales cycle length, average deal size, and sales velocity. These will give you deeper insights into your sales process and team performance.
Step 3: Collect and verify your data
Now it’s time to collect your data. Pull from your CRM, financial systems, and any other relevant sources. But don’t just dump raw numbers into your sales report. Take the time to verify your data, and check for any inconsistencies or errors that could skew your insights.
Step 4: Tell a story with your data
An effective sales report doesn’t just present data—it tells a story. Use visualizations like charts and graphs to make your data easy to read at a glance. But don’t stop there. Provide context for your numbers. Why did sales go up last month? What caused that dip in win rate? Your insights and explanations are what turn raw data into actionable intelligence.
Step 5: Make it actionable
The best sales reports don’t just inform—they inspire action. For each key finding in your report, include a specific, actionable recommendation. If you’ve identified a drop in win rate, for example, you might recommend more sales training or a review of your qualifying process.
Step 6: Customize for your audience
Remember, different stakeholders need different levels of detail. Your CEO will want a high-level overview of revenue and growth, your sales managers will want more detailed data on team performance. Create versions of your sales report for each key audience.
Step 7: Review and refine regularly
The sales landscape is always changing and so should your reporting. Review your reports regularly. Are they giving you the insights you need? Are there new metrics you should be tracking? Don’t be afraid to adjust as needed.
Follow these steps and you’ll have sales reports that are not just informative but transformative—giving you the insights you need to drive your sales strategy and hit your revenue goals.
Using technology for better sales reporting
In this digital age, relying on spreadsheets for your sales reporting is like trying to win a Formula 1 race with a bike. To stay ahead of the game you need to use modern technology. Here’s how you can use the latest tools to turbocharge your reporting:
AI analytics
Artificial Intelligence (AI) and Machine Learning (ML) are changing sales reporting. These technologies can process huge amounts of data to uncover hidden patterns and predict future trends with uncanny accuracy.
For example, AI can analyze your historical sales data, current pipeline, and external factors like market trends to forecast your sales better than traditional methods. It can also tell you which leads are most likely to convert so your team can focus on the right ones.
Here’s an example: Your AI analytics tool shows that deals closed within 30 days of a product demo have a 75% higher average deal size. With that insight, you could adjust your sales strategy to get more demos and potentially increase your revenue.
Pro tip: Look for sales analytics platforms that offer AI-powered features. These tools will give you predictive insights not just sales reports on past performance. When evaluating options ask vendors for case studies or concrete examples of how their AI has helped businesses like yours.
Live dashboards
Month-end reports are a thing of the past. Real-time dashboards give you instant insights into your sales activity and outcomes.
Imagine having a central hub where you can see live updates on key metrics like daily sales, pipeline value, and team activity levels. This visibility allows you to see trends or issues as they happen and make timely interventions that can make a big difference to your bottom line.
For example, a live dashboard could alert you to a sudden drop in sales in a particular region. Instead of finding out weeks later in a monthly sales report you can contact the regional manager, find out what’s going on (maybe a local holiday you didn’t know about), and adjust your expectations or strategy accordingly.
Real-time Pipeline Analysis in Forecastio:
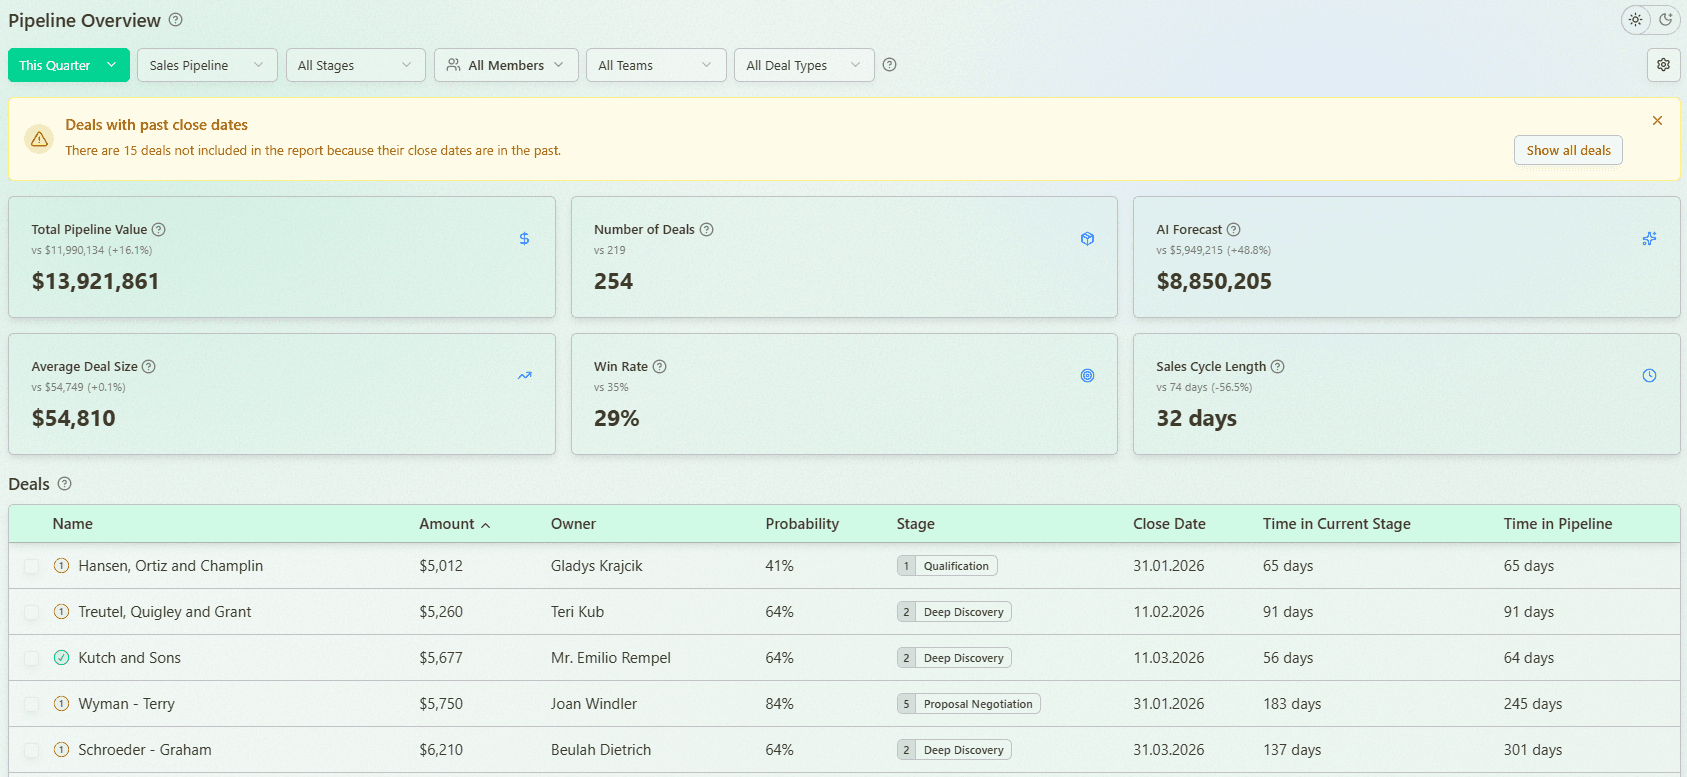
Pro tip: When setting up your dashboard don’t try to include every metric under the sun. Focus on the key performance indicators (KPIs) that really matter to your business. A cluttered dashboard is as useless as no dashboard at all. Start with 5-7 core metrics and only add more if they give you actionable insights.
Integration is everything: Breaking down data silos
Your data doesn’t exist in a bubble. To get a full picture of your performance you need to integrate data from multiple sources – your CRM, marketing automation platform, customer support system, and financial software.
Modern sales reporting tools have robust integration capabilities so you can pull data from multiple sources into one report. This will give you insights you might miss when looking at data in isolation.
For example, by integrating your CRM data with your customer support tickets you might find that customers who raise a support ticket within the first 30 days of purchase are 50% more likely to renew. This insight could prompt you to implement a proactive support strategy for new customers and increase your retention rates.
Pro tip: When choosing a sales reporting tool prioritize those that have easy integrations with your existing tech stack. The easier it is to connect your data sources the more likely your team will use the tool. Look for platforms that have pre-built connectors to popular business tools and APIs for custom integrations.
The value of prebuilt reports: Why reinvent the wheel?
While custom reports are valuable there’s also great power in using prebuilt report templates. Here’s why:
Time-saving: Prebuilt reports let you hit the ground running. Instead of spending hours designing report layouts and choosing metrics you can focus on the insights. This is especially valuable for new sales leaders or when implementing a new reporting system.
Best practices built in: Quality prebuilt reports are designed by experts who understand sales reporting best practices. They often include metrics and visualizations you might not have thought of. For example, a prebuilt “Sales Pipeline Health” report might include metrics like deal velocity and win rate by stage, giving you a more complete view of your pipeline than you would have thought to include.
Consistency: Using standard sales report templates ensures consistency across your organization, making it easier to compare performance across teams or periods. This is important for large organizations or those with multiple sales teams.
Customization options: Most prebuilt reports still offer customization options so you can tailor them to your specific needs while benefiting from a solid foundation. You might start with a standard “Monthly Sales Performance” template and then add custom fields to track metrics unique to your business.
Scalability: As your business grows prebuilt reports can be replicated for new teams or departments so you can have consistent reporting across the organization without extra design work.
Pro tip: Look for sales reporting solutions that have a library of prebuilt reports. Start with these as your base and then customize as needed. This will speed up your reporting process. When evaluating options ask the vendor to show you their template library and explain how each report type can be customized.
Advanced techniques for sales leaders
Now that we’ve covered the tools let’s look at some advanced techniques to take your sales reporting to the next level:
Cohort analysis: Customer behavior over time
Cohort analysis involves grouping customers based on shared characteristics (like sign-up date) and tracking their behavior over time. This can reveal valuable insights about customer lifetime value, churn rates, and the long-term impact of your sales and marketing efforts.
For example, you might find that customers who signed up during a particular promotional period have higher lifetime values. This could inform your future marketing strategies and sales forecasts.
Let’s say you have a SaaS business and do a cohort analysis of customers based on their sign-up month. You find that customers who signed up during months when you offered extended free trials have a 30% higher retention rate after 1 year compared to other cohorts. This could prompt you to make extended trials a regular part of your sales strategy.
Pro tip: Start your cohort analysis with time-based cohorts (e.g. customers who signed up in the same month) as these are often the easiest to set up and interpret. As you get more comfortable with cohort analysis you can move on to behavior-based cohorts (e.g. customers who used a particular feature in their first week) for even deeper insights.
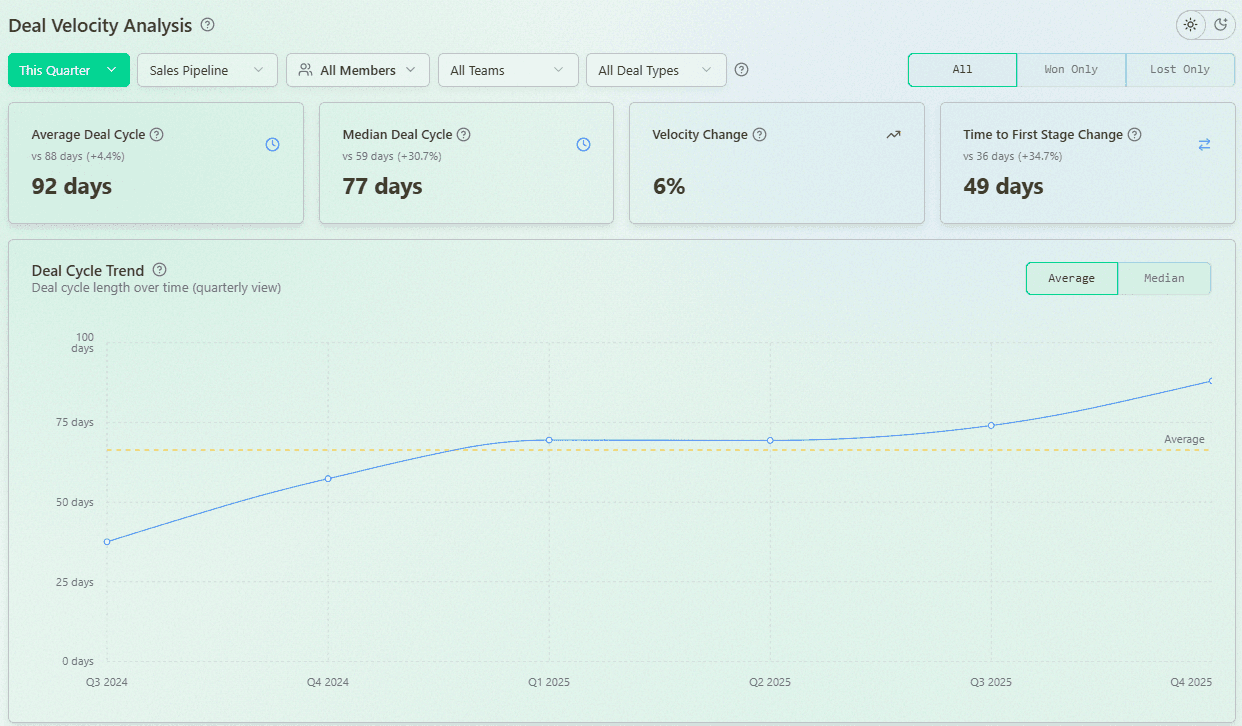
Funnel velocity: Measuring the speed of your sales process
While most sales leaders track conversion rates at each stage of the sales funnel few pay attention to funnel velocity – the speed at which leads move through your sales process. By measuring how quickly leads move from one stage to the next you can identify bottlenecks in your sales process and optimize for faster closes.
For example, you might find that deals get stuck at the proposal stage and take 15 days to move to the next stage. This could prompt you to investigate why – perhaps your proposal process is too complex or your sales team needs more training on handling objections at this stage.
Pro tip: Set up alerts for deals that have been in a particular stage for longer than average. This will allow your team to proactively address stalled deals before they go cold. Consider implementing a “deal velocity score” for each opportunity that takes into account both the time spent in each stage and the probability of closing based on historical data.
Win/Loss analysis: Learning from every deal
Every closed deal – won or lost – is a learning opportunity. Implement a systematic win/loss analysis process to understand the factors that impact your sales outcomes. This might involve surveys, interviews with customers or prospects, and analysis of deal data.
Look for patterns in your wins and losses. Are there particular features that always win deals? Do losses occur at a specific stage in the sales process? Use this information to refine your sales strategy and improve your win rate over time.
For example, a thorough win/loss analysis might show that deals where you provided a product demo in the first two weeks of engagement have a 60% higher win rate. This could prompt you to make early demos a part of your sales process.
Pro tip: Don’t just look at the final outcome of a deal. Analyze the entire sales process to identify the key moments that impacted the result. Was a particular competitor mentioned in lost deals? Did wins correlate with a certain team member or sales material being used? This information will help you optimize your entire sales approach.
Predictive lead scoring: Focusing on high-value prospects
Not all leads are created equal. Predictive lead scoring uses historical data and machine learning algorithms to identify which leads are most likely to convert. This allows your sales team to focus on the best prospects and improve overall efficiency and win rate.
For example, your predictive lead scoring model might determine that leads from the finance industry who have visited your pricing page more than twice and downloaded a specific whitepaper are 3x more likely to convert than average. Your sales team can use this information to prioritize their outreach.
Pro tip: Review and refine your lead scoring model regularly. As your business changes and market conditions evolve the factors that indicate a high value lead will change. Consider A/B testing your lead scoring model to continuously improve its accuracy.
Putting it all together: The future of sales reporting
As we move forward sales reporting will continue to evolve. We’re moving towards a world of predictive and prescriptive analytics where your reports don’t just tell you what happened but what will happen and what to do about it.
Imagine a sales report that shows you your current performance and also predicts next quarter’s results and recommends specific actions to improve outcomes. This is the power of advanced sales reporting and it’s available to sales leaders who are willing to adopt new technologies and approaches.
For example, a future-focused sales report might say:
Your team is on track to miss next quarter’s target by 15%
This is because of a 20% drop in deal velocity in the enterprise segment
To fix this you should increase the number of product demos for enterprise prospects by 30% and provide additional training to your enterprise sales team on handling specific objections
This level of insight allows you to be proactive rather than reactive in your sales management and potentially turn a projected miss into a win.
Implementing advanced sales reporting
The benefits of advanced sales reporting are clear but implementing these strategies can seem overwhelming. Here’s a plan to get you started:
Assess your current state: Start by reviewing your current reporting processes. What’s working well? Where are the gaps? This will help you prioritize your efforts.
Define your objectives: What specific outcomes do you want to achieve with better sales reporting? Better forecast accuracy? Higher win rates? Faster sales cycles? Clear objectives will guide your implementation.
Choose your tools: Based on your assessment and objectives research and select the sales reporting tools that fit your needs. Remember to consider factors like integration, scalability, and user experience. If your CRM is HubSpot, the best choice for you will be Forecastio.
Start small and iterate: Don’t try to implement everything at once. Start with one or two sales reports or dashboards, get feedback from your team, and refine before you expand.
Invest in training: Make sure your team knows how to use the new tools and interpret the reports. The most advanced system is useless if your team can’t leverage the insights.
Create a data-driven culture: Encourage your team to make decisions based on data, not gut feelings. Review reports in team meetings and celebrate data-driven wins.
Continuously improve: As your team gets comfortable with advanced reporting keep pushing the boundaries. Regularly review your reporting needs and explore new tools and approaches.
Remember sales reporting isn’t just about tracking numbers – it’s about driving action and results. By using these advanced tools and approaches you can turn your sales reporting into a forward-looking exercise.
Your sales reports are your path to revenue growth. Use them wisely. With the right approach, your sales reports can be your secret weapon, giving you the insights to beat the competition and hit your biggest sales targets.
Book a demo with Forecastio to take your sales reporting to the next level.
Share:


