
How To Calculate Win Rate in Just a Few Steps

Dmytro Chervonyi
CMO at Forecastio

Revenue problem solved: Discover exactly how to calculate, benchmark, and improve your sales win rate to dramatically increase your team's effectiveness—without working longer hours or burning through more leads.
What You'll Learn in This Guide
The exact sales win rate formula top-performing teams use to track performance
How to calculate win rate by deal size, sales rep, and market segment
SaaS win rate benchmarks: What "good" looks like (with industry-specific data)
5 data-backed strategies proven to lift win rates by 15-45%
Win rate vs. close rate: Critical differences sales leaders must understand
Interactive win rate calculator to measure your team's current performance
Most sales leaders track overall revenue but miss the crucial metric that predicts future performance: sales win rate. Your win rate reveals the true health of your sales process and shows exactly where to focus for maximum impact. Knowing how to calculate win rate effectively — whether by sales rep, market segment, or deal size — provides clarity on where your pipeline is strong and where it’s underperforming. For teams using Salesforce, understanding how to calculate win rate in Salesforce ensures consistency and eliminates manual guesswork. Similarly, knowing how to calculate a win rate across different timeframes and learning how to calculate win rate sales performance metrics gives leaders a granular view of sales effectiveness.
This guide shares battle-tested strategies from analyzing thousands of sales opportunities across our customer base, revealing exactly what separates average performers (20-30% win rate) from elite teams (35%+ win rate).
From Measurement to Action with Forecastio
Calculating your win rate is only the first step—turning those insights into actionable improvements is where real growth happens. Forecastio helps sales leaders bridge that gap by transforming win rate data into predictive forecasts within HubSpot. With AI-driven analysis and up to 95% forecast accuracy, Forecastio highlights where deals are likely to stall, identifies hidden opportunities, and provides strategies to improve win rates across the pipeline. By combining win rate measurement with AI forecasting, sales teams not only understand performance but also gain a roadmap to improve it in real time.
What is Sales Win Rate? The Core Sales Performance Indicator
Your sales win rate is the percentage of opportunities that convert into closed-won deals out of all deals that reach a decision point. It's your sales team's batting average –– revealing how effectively you're converting qualified prospects into revenue.
Sales Win Rate Formula:
Win Rate = (Number of Won Opportunities ÷ Total Closed Opportunities) × 100%
For example, if your team engaged with 100 qualified opportunities last quarter and 30 became customers, your sales win rate would be 30%.
The proposal win rate is a similar concept, focusing on the success rates for proposals submitted in response to RFPs. Understanding and improving your proposal win rate is crucial for enhancing your chances of winning more bids, whether for incumbent or new client proposals.
Why Track Sales Win Rate?
Unlike raw revenue numbers that fluctuate based on deal size, your win rate reveals the fundamental health of your sales operation. It provides insight into:
Sales process efficiency - Are you converting prospects effectively?
Team selling capabilities - Which sales tactics are working?
Product-market fit - Is your offering resonating with prospects?
Competitive position - How do you perform against alternatives?
Resource allocation - Are you focusing effort on the right opportunities?
High-performing sales organizations obsess over win rate because it's a leading indicator of revenue performance. When your win rate improves, revenue growth follows—often with less effort and lower costs than traditional approaches like simply increasing lead volume.
What Causes Low Sales Win Rates?
A low sales win rate is usually a symptom of deeper problems in the sales process rather than a problem with closing skills alone.
The most common causes of low win rates include:
poor lead and opportunity qualification
unrealistic customer fit assumptions
weak discovery and stakeholder engagement
long sales cycles and deal slippage
weak pipeline management
slow follow-up and response times
strong competitive pressure
inconsistent sales execution across the team
Analyzing win rate alongside deal age, pipeline stage conversions, and sales cycle length helps sales leaders identify the root causes of lost opportunities and improve overall sales performance.
Win Rate Calculator: How to Measure Your Sales Success

Before you can improve your win rate, you need to calculate it accurately. While the basic formula is straightforward, there are several approaches depending on what insights you need.
Basic Win Rate Formula and Calculation Methods
The fundamental win rate calculation looks at your closed won deals against total closed opportunities: Sales Win Rate = (Number of Won Deals ÷ Total Closed Deals) × 100%
For example, if your sales team closed 180 total opportunities last quarter and won 72 of them, your win rate would be: 72 ÷ 180 × 100% = 40%
Advanced Win Rate Calculations
For deeper insights, use these specialized formulas:
1. Period Win Rate Formula: Period Win Rate = (Won Deals in Period ÷ Total Closed Deals in Period) × 100% –– This tracks performance changes over time, revealing trends and the impact of new strategies.
2. Opportunity Win Rate Formula: Opportunity Win Rate = (Won Opportunities ÷ Total Qualified Opportunities) × 100% –– This shows how effectively you convert qualified prospects into customers.
3. Segment Win Rate Formula: Segment Win Rate = (Won Deals in Segment ÷ Total Closed Deals in Segment) × 100% –– Use this to compare performance across different deal sizes, industries, or regions.
Free Interactive Win Rate Calculator Tool
Stop manually tracking your win rates with spreadsheets. Use our free Win Rate Calculator to instantly calculate your win rate and benchmark it against industry standards.
Close Rate vs. Win Rate: Critical Differences Every Sales Leader Must Know
One of the most common confusions in sales performance metrics is the difference between win rate and close rate. While related, they tell fundamentally different stories about your sales process.
Win Rate | Close Rate |
|---|---|
Focuses on deals that reach a decision point (yes/no) | Includes all opportunities in pipeline, including in-progress deals |
Measures conversion effectiveness of qualified opportunities | Measures overall pipeline movement from beginning to end |
Formula: Won Deals ÷ Total Closed Deals | Formula: Closed Deals (Won or Lost) ÷ Total Opportunities Created |
Best for: Understanding sales team effectiveness | Best for: Understanding overall conversion funnel |
Real-World Example: Win Rate vs. Close Rate
A SaaS company we worked with had:
200 total opportunities in their pipeline
120 opportunities reached a decision point (won or lost)
60 became customers
Their sales win rate was 50% (60 wins ÷ 120 decisions). Their close rate was 60% (120 closed ÷ 200 total opportunities)
This difference revealed that while their sales team excelled at closing qualified opportunities, they needed to improve their early-stage qualification process to avoid wasting time on poor-fit prospects.
Understanding both metrics gives you a complete picture of your sales performance. Win rate shows how effectively you close qualified opportunities, while close rate reveals how efficiently your entire sales process converts prospects to customers.
SaaS Win Rate Benchmarks: What's a Good Sales Win Rate in 2025?
"What's a good win rate?" This is invariably the first question sales leaders ask. While the answer varies by industry and sales model, we can provide reliable SaaS win rate benchmarks based on extensive research and real-world data.
Average SaaS Win Rate Benchmarks by Company Size
Market Segment | Average Win Rate | Top Performer Win Rate |
|---|---|---|
Enterprise (>1000 employees) | 20-25% | 30%+ |
Mid-Market (100-999 employees) | 25-35% | 40%+ |
SMB (<100 employees) | 30-40% | 45%+ |
Overall Industry Average | 20-30% | 35%+ |
SaaS Win Rate Benchmarks by Deal Size
Deal Size | Average Win Rate |
|---|---|
Small (<$50,000) | 35-45% |
Medium ($50,000-$100,000) | 25-35% |
Large (>$100,000) | 15-25% |
What Determines a "Good" Win Rate?
These average sales win rate benchmarks should serve as guidance, not absolute targets. Your optimal win rate depends on several factors:
Sales cycle length –– Longer sales cycles typically have lower win rates
Deal complexity –– More complex solutions generally have lower win rates
Average contract value –– Higher ACVs usually correlate with lower win rates
Market maturity –– Established markets often have lower win rates due to competition
Competitive landscape –– More competitors generally means lower win rates
The most meaningful benchmark is improvement over time. Top-performing organizations focus on continuously increasing their win rates rather than hitting arbitrary industry benchmarks.
Calculate How Your Win Rate Compares →
Sales Efficiency Formula: How Win Rate Impacts Your Bottom Line
Your sales win rate directly impacts your sales efficiency—a crucial metric for scaling B2B SaaS companies. Understanding this connection helps quantify the ROI of win rate improvement initiatives.
What is Sales Efficiency?
The basic sales efficiency formula divides new Annual Recurring Revenue (ARR) by total sales and marketing spend:
Sales Efficiency = New ARR ÷ Sales & Marketing Spend
A higher sales win rate dramatically improves this ratio because:
You need fewer opportunities to hit revenue targets
Sales cycles shorten as qualified deals move through your pipeline faster
Customer acquisition costs decrease since you're converting more efficiently
The Win Rate Multiplier Effect
We recently helped a SaaS company improve their win rate from 25% to 35%. The impact on their sales efficiency was remarkable:
Metric | Before Improvement | After Improvement | Impact |
|---|---|---|---|
Win Rate | 25% | 35% | +40% |
Opportunities Needed for $1M ARR | 40 | 29 | -28% |
Marketing Spend | $500,000 | $350,000 | -30% |
Sales Efficiency Ratio | 1.0 | 1.43 | +43% |
This efficiency gain freed up resources for product development and customer success initiatives, creating a virtuous cycle of improvement.
Calculate Your Sales Efficiency
Use our free Sales Efficiency Calculator to assess your current performance and model the impact of win rate improvements on your bottom line.
Calculate Your Sales Efficiency →
5 Powerful Win Rate Patterns That Drive Revenue Growth
The real power of win rate analysis isn't in the overall number—it's in understanding the patterns beneath it. By segmenting your win rate across different dimensions, you'll uncover actionable insights that can dramatically improve performance.

1. Deal Size Win Rate Analysis
One of the most revealing segments to analyze is your sales win rate by deal size. Many organizations have dramatically different success rates based on opportunity value:
Deal Size Win Rate = (Won Deals in Size Category ÷ Total Closed Deals in Size Category) × 100%
Case Study: A B2B SaaS customer discovered they had a 45% win rate for deals under $50,000, but only a 15% win rate for deals over $100,000. This insight led them to develop specific strategies for larger opportunities, resulting in a 20% increase in their high-value deal win rate within one quarter.
2. Sales Rep Performance Analysis
Individual rep performance analysis isn't about creating a leaderboard—it's about identifying valuable insights that can lift the entire team:
Rep Win Rate = (Rep's Won Deals ÷ Rep's Total Closed Deals) × 100%
Performance Index = Rep's Win Rate ÷ Team Average Win Rate
By comparing top performers with the rest of your team, you can identify specific behaviors, approaches, and techniques that consistently lead to higher win rates.
3. Industry and Segment Win Rate Analysis
Win rates often vary significantly across different customer segments:
Case Study: An enterprise customer using Forecastio's analytics discovered their sales win rate was 40% higher in the healthcare sector compared to financial services. This data-driven insight led them to refine their target market strategy, resulting in more efficient resource allocation and higher overall win rates.
4. Sales Stage Win Rate Analysis
Understanding conversion rates at each stage of your sales process reveals critical bottlenecks:
Stage Conversion Rate = (Deals Advancing from Stage ÷ Total Deals in Stage) × 100%
This analysis helps identify where deals commonly stall or fall through, allowing you to implement targeted improvements and increase overall sales conversion rate.
5. Time-Based Win Rate Analysis
The time a deal spends in each stage often correlates strongly with likelihood to close:
Case Study: A mid-sized SaaS company discovered that deals staying in the proposal stage beyond 21 days had a 70% lower chance of closing. This insight led them to implement a new proposal follow-up process, resulting in a 15% improvement in their proposal-to-close ratio.
By analyzing these five key dimensions, you'll identify specific areas for improvement that will have the greatest impact on your overall win rate.
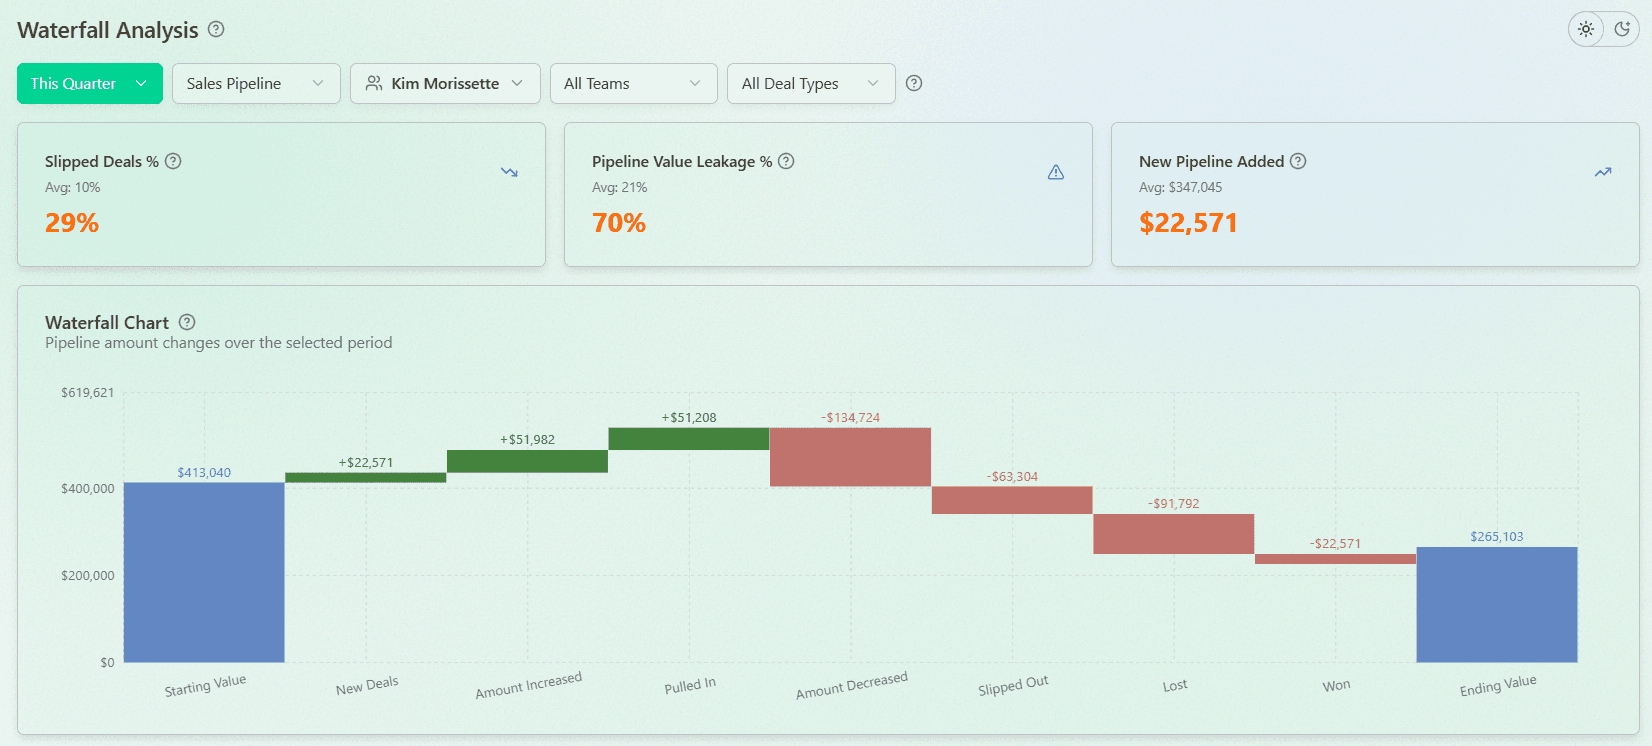
How Deal Slippage Decreases Win Rate
There is a simple rule in sales: the longer a deal stays in the pipeline, the less likely it is to close.
Deal slippage, especially repeated close date changes, is one of the strongest predictors of declining win rate.
For example:
Deals closing within 30 days → 35% win rate
Deals open 60–90 days → 22% win rate
Deals open 120+ days → 10% win rate
As deals age, urgency decreases, priorities shift, and momentum fades. What looks like an active opportunity often becomes a low-confidence deal.
If your pipeline contains many aging or slipped deals, overall win rate will naturally decline. Not because the team is underperforming, but because weak deals stay alive too long.
To protect win rate, track deal age, repeated close date changes, and win rate by deal age segment. Slippage is not just a timing issue. It is a probability signal.
Win Rate and Deal Timing Correlation
Win rate is not only influenced by deal quality. It is strongly tied to how long a deal stays in the pipeline.
There is a clear pattern across most B2B sales teams:
Deals that move quickly tend to close
Deals that stay open longer tend to lose
For example:
Deals closing within 30 days → higher win rates
Deals open 60–90 days → noticeably lower win rates
Deals open 120+ days → low probability of closing
As deals age, urgency decreases, priorities shift, and momentum fades. What looks like an active opportunity often becomes a low-confidence deal.
This is why win rate should always be analyzed together with deal timing. Tracking win rate by deal age or time in stage helps sales leaders identify weak opportunities early and focus on deals that are more likely to close.
5 Data-Backed Strategies to Improve Your Sales Win Rate
Based on analyzing thousands of sales opportunities across our customer base, we've identified five proven strategies that consistently improve win rates. These approaches are particularly effective for B2B SaaS companies and directly address the most common win rate challenges.
1. Strengthen Lead and Opportunity Qualification
Forecastio's analysis shows that deal quality has a direct and outsized impact on win rates.
Key Finding: Deals that meet clearly defined qualification criteria are 2–3× more likely to close than poorly qualified opportunities that enter the pipeline too early.
Implementation Steps:
Define a clear Ideal Customer Profile based on firmographics, use case, and buying maturity
Introduce a consistent qualification framework (for example MEDDICC, BANT, or a custom checklist)
Enforce mandatory qualification fields before advancing deals to later stages
Regularly review disqualified deals to refine qualification rules
Impact: Companies that tighten qualification typically see a 20–40% increase in win rates, often while reducing pipeline volume and sales cycle length.
2. Optimize Your Sales Process with Stage-by-Stage Analysis
The journey from prospect to customer should be smooth and predictable. Here's how top performers use analytics to refine their sales process:
Key Tactic: Monitor conversion rates between stages using this formula:
Stage Conversion Rate = (Deals Advancing ÷ Total Deals in Stage) × 100%
Implementation Steps:
Map your entire sales process from lead to close
Calculate conversion rates for each stage transition
Identify stages with below-average conversion rates
Implement targeted improvements for problem stages
Measure impact on overall win rate
Impact: Companies implementing stage-by-stage optimization see an average 15% improvement in overall win rate within 90 days.
3. Engage Multiple Decision-Makers Early
Our data analysis shows that early stakeholder engagement is one of the strongest predictors of deal success:
Key Finding: Deals with multiple stakeholders involved in the first two discovery calls have a 45% higher win rate than single-stakeholder deals.
Implementation Steps:
Develop stakeholder mapping templates for sales teams
Create engagement plans for each key stakeholder type
Design discovery call formats that encourage multiple attendees
Track stakeholder engagement throughout the sales process
Measure impact on win rate by stakeholder involvement level
Impact: Teams that implement structured multi-stakeholder engagement typically see a 20-30% win rate improvement for complex deals.
4. Implement Technical Validation Early in the Sales Process
Early technical discussions dramatically improve conversion rates for SaaS products:
Key Finding: Deals with technical validation calls in the early stages have double the win rate of those without.
Implementation Steps:
Create a standardized technical validation process
Develop clear qualification criteria for technical fit
Train solutions engineers to support early-stage discussions
Measure technical validation impact using this formula:
Technical Impact = Win Rate (With Technical Validation) - Win Rate (Without Technical Validation)
Impact: Companies implementing early technical validation typically see a 25-35% increase in win rates for complex technical products.
5. Create a Rapid-Response System for Deals at Risk
Our analysis shows that responsiveness strongly correlates with win rates:
Key Finding: Deals that receive responses within 4 hours to prospect questions have a 35% higher close rate than those with 24+ hour response times.
Implementation Steps:
Implement response time tracking in your CRM
Create an escalation system for unanswered queries
Develop a knowledge base for common questions
Track win rates against response time metrics
Impact: Organizations implementing rapid response systems see an average 15-25% improvement in win rates.
How to Implement a Win Rate Optimization System: 3-Step Process
Understanding win rate patterns is just the beginning. The real challenge lies in implementing a sustainable system for continuous improvement. Here's the exact process our most successful customers use:
Step 1: Establish Your Win Rate Baseline
Before making any changes, document your current performance across key metrics:
Overall sales win rate
Win rate by deal size (SMB, Mid-Market, Enterprise)
Win rate by sales rep and team
Win rate by lead source (inbound vs. outbound)
Average time in each sales stage
Conversion rates between pipeline stages
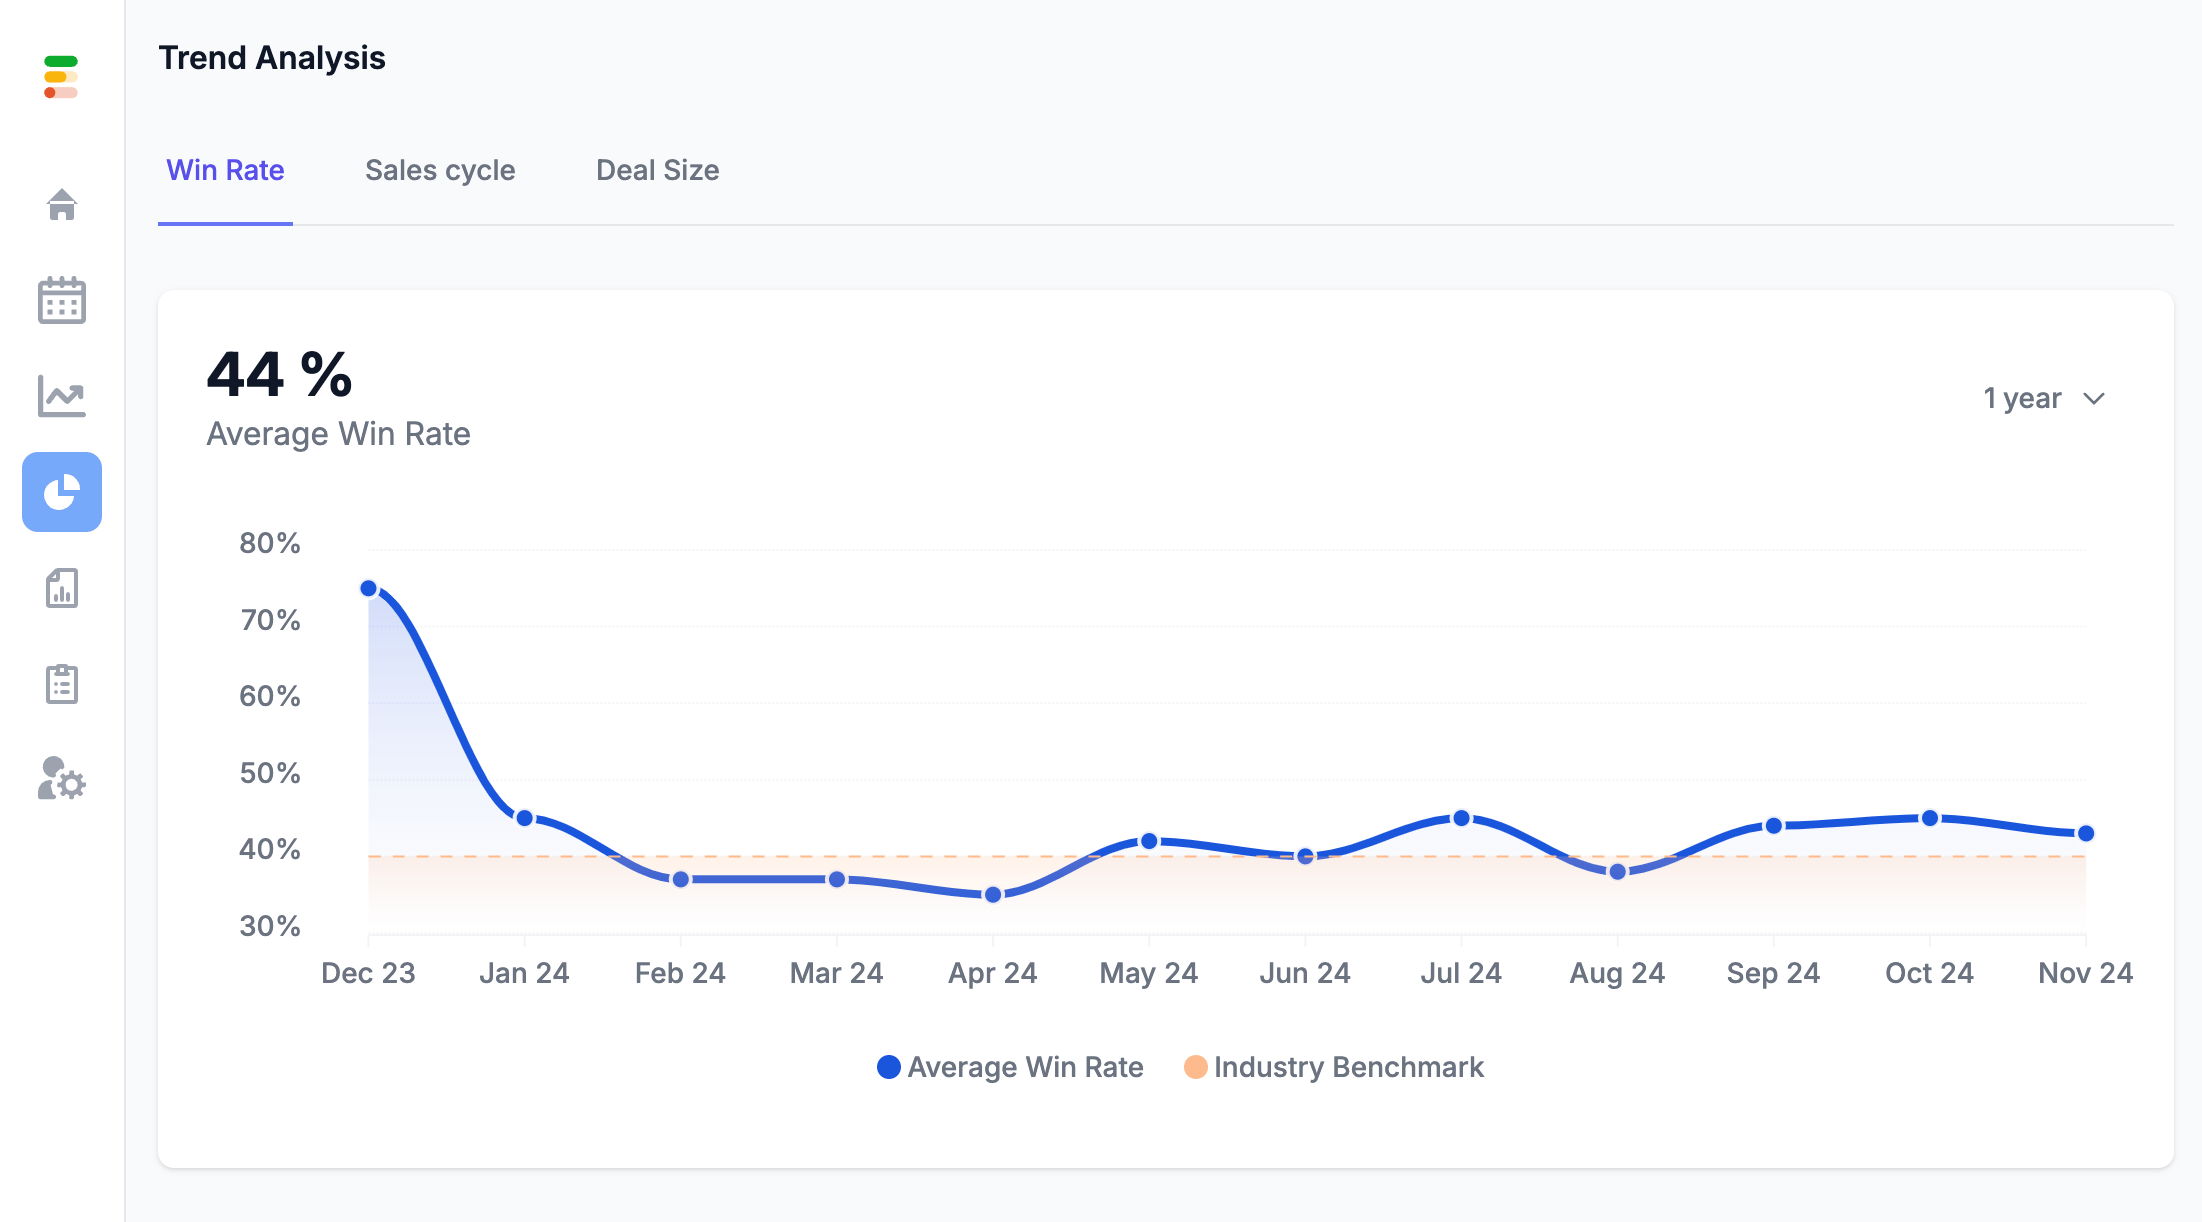
Pro Tip: Use our Win Rate Trend Analysis feature to automatically calculate these metrics and create a visual baseline for your improvement journey.
Step 2: Create a Continuous Improvement Cycle
Successful win rate optimization is an ongoing process with clear checkpoints:
Monthly Reviews:
Track win rate trends against targets
Identify emerging patterns
Make tactical adjustments to address issues
Celebrate wins and improvements
Quarterly Deep Dives:
Analyze longer-term win rate trends
Review resource allocation based on segment performance
Update benchmarks based on market conditions
Adjust strategies for underperforming segments
Annual Strategic Planning:
Set new baseline targets
Plan major process improvements
Align win rate goals with broader company objectives
Develop comprehensive improvement roadmap
Step 3: Leverage Technology for Win Rate Insights
Modern sales teams need sophisticated tools to track and improve their win rates:
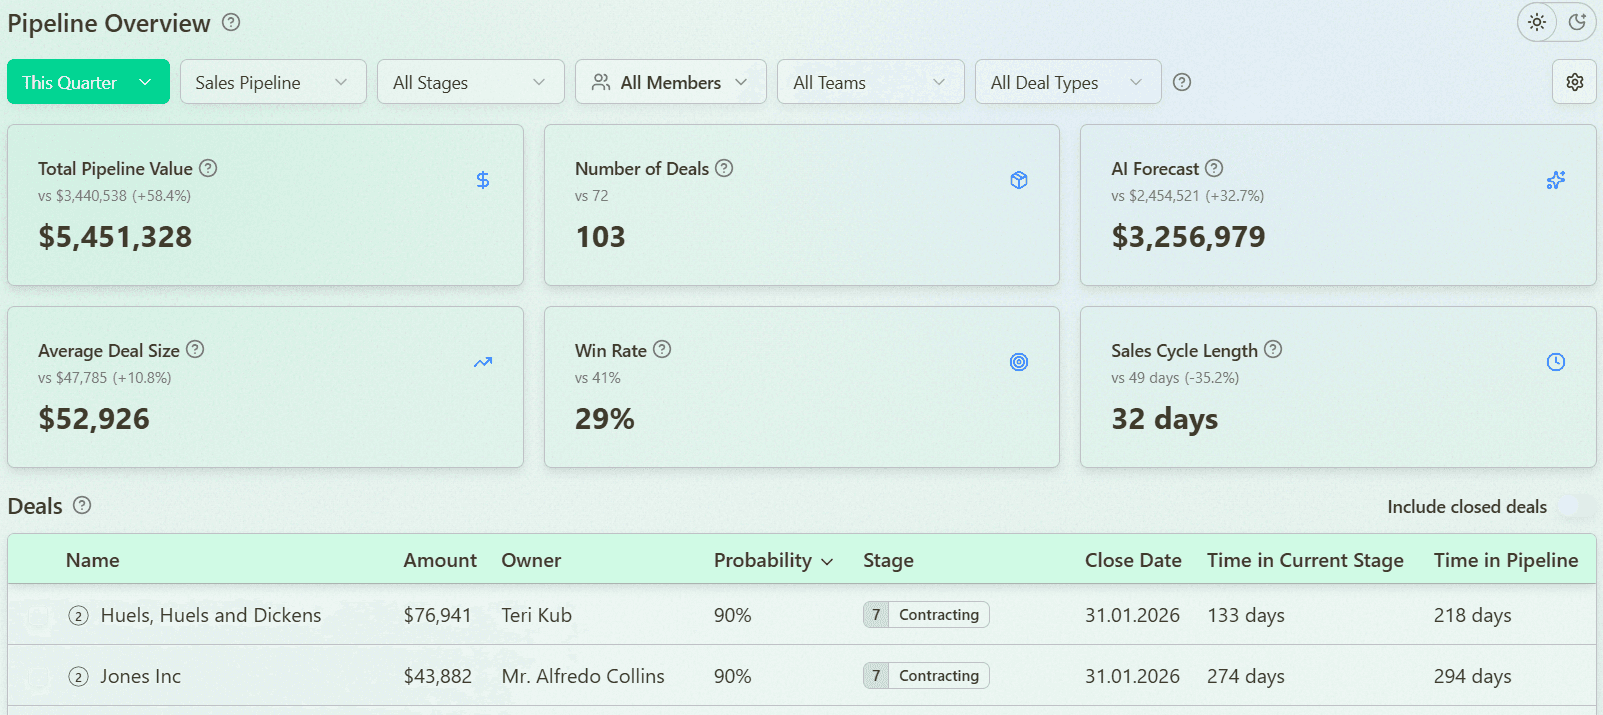
Sales Analytics Capabilities You Need:
Real-time win rate tracking
Automated trend analysis
Segment comparison
Deal risk prediction
Performance benchmarking
Forecastio's platform integrates directly with your HubSpot CRM, providing these capabilities without complex setup or maintenance. Our analytics engine gives you immediate insights into your sales performance and helps you identify specific improvement opportunities.
Common Win Rate Mistakes That Hurt Sales Efficiency
Sales teams often track win rate but still fail to improve sales efficiency because the metric is misunderstood or misused. Here are the most common mistakes that prevent win rate from becoming a true performance lever.
Mixing different deal types into one win rate
Combining SMB, mid-market, and enterprise deals into a single win rate hides meaningful differences in buying behavior, deal complexity, and sales cycles. A “healthy” overall win rate may mask serious conversion issues in specific segments.
Better approach:
Track win rate separately by deal size, segment, or motion to uncover where efficiency actually breaks down.
Ignoring stage-level win rates
Many teams only look at win rate at the deal level (closed-won vs closed-lost) and ignore how deals convert between pipeline stages. This makes it difficult to understand where deals are being lost and why.
Better approach:
Measure conversion rates between stages to identify bottlenecks and improve qualification, discovery, or proposal execution.
Focusing on win rate without context
A rising win rate can look like progress, but without context it can be misleading. For example, win rate may increase simply because reps are working fewer, safer deals, while total revenue or growth slows down.
Better approach:
Always analyze win rate together with deal volume, deal size, and sales cycle length to understand its real impact on revenue efficiency.
Treating win rate as a lagging KPI only
Win rate is often reviewed after deals are already closed, which limits its usefulness for proactive management. When used only as a retrospective metric, it becomes a reporting number rather than a decision-making tool.
Better approach:
Use win rate trends and stage conversion patterns to adjust qualification criteria, coaching focus, and pipeline strategy earlier in the cycle.
Trying to “optimize” win rate at any cost
Some teams push for higher win rates by becoming overly conservative, disqualifying too aggressively, or avoiding competitive deals. While this may improve the metric on paper, it can reduce pipeline flow and long-term growth.
Better approach:
Optimize win rate in balance with pipeline coverage and growth targets, not in isolation.

Frequently Asked Questions About Sales Win Rate
What is a good win rate in sales?
A good sales win rate typically ranges from 20-30% for most B2B SaaS companies, with top performers achieving 35% or higher. However, what constitutes a "good" win rate varies by industry, company size, and deal complexity. Enterprise deals typically see win rates of 20-25%, while SMB-focused sales teams often achieve 30-40%. The most important benchmark is improvement over time rather than hitting an arbitrary target.
How do you calculate win rate in sales?
To calculate your sales win rate, divide the number of won opportunities by the total number of closed opportunities (both won and lost), then multiply by 100. The win rate formula is:
Win Rate = (Number of Won Opportunities ÷ Total Closed Opportunities) × 100%
For example, if you closed 50 deals and won 15 of them, your win rate would be 30% (15 ÷ 50 × 100%).
What's the difference between close rate vs win rate?
Win rate measures the percentage of deals that convert into customers out of those that reach a decision point (won or lost). Close rate looks at all opportunities in your pipeline, including those still in progress. Win rate focuses on sales effectiveness with qualified opportunities, while close rate measures your entire funnel's conversion efficiency.
For example, a team might have a 50% win rate (winning half of all decided deals) but only a 30% close rate (when including all pipeline opportunities).
What is the average SaaS win rate?
The average SaaS win rate benchmark is between 20-30% across the industry. However, this varies significantly by company size and deal value. Enterprise SaaS companies typically see win rates of 20-25%, mid-market companies achieve 25-35%, and SMB-focused teams often reach 30-40%. For large deals over $100,000, average win rates drop to 15-25%, while smaller deals under $50,000 typically convert at 35-45%.
How do you calculate win rate by industry?
To calculate sales win rate by industry, group your opportunities by industry segment, then divide won opportunities by total closed opportunities in each segment:
Industry Win Rate = (Won Deals in Industry ÷ Total Closed Deals in Industry) × 100%
This analysis often reveals dramatic differences in performance across sectors.
For example, our customers frequently discover their win rates vary by 15-40% between different industries, highlighting opportunities for strategic focus.
How can I improve my sales win rate?
Improve your sales win rate by implementing these data-proven strategies:
Engage multiple stakeholders early –– Deals with multiple decision-makers in the first two discovery calls have 45% higher win rates
Accelerate your response times –– Deals with responses within 4 hours have 35% higher close rates
Include technical validation early –– Early technical discussions double win rates for complex products
Optimize your sales stages –– Identify and fix conversion bottlenecks between pipeline stages
Implement data-driven coaching –– Train your team based on patterns from your top performers
What is the win rate calculation for different deal sizes?
To calculate win rate by deal size, group your opportunities into size categories (e.g., small, medium, large), then apply the win rate formula to each segment:
Deal Size Win Rate = (Won Deals in Size Category ÷ Total Closed Deals in Size Category) × 100%
Most companies discover significant differences in performance across deal sizes.
For example, the average B2B SaaS company wins 45% of small deals under $50,000 but only 15% of deals over $100,000.
How is win rate different from conversion rate?
Win rate specifically measures how often you win deals against competitors when prospects make a decision. Conversion rate is a broader metric that can apply to any stage of the funnel, such as visitor-to-lead or lead-to-opportunity conversion. Win rate is decision-focused, while conversion rate tracks progression through your entire sales and marketing process.
How often should I calculate my sales win rate?
For most B2B SaaS companies, monthly win rate calculation provides the right balance between timely insights and meaningful sample sizes. However, companies with high deal volumes may benefit from weekly analysis, while those with longer sales cycles or fewer opportunities might choose quarterly reviews. Regardless of frequency, the key is consistent tracking using the same calculation method to identify trends and improvement opportunities.
What is the win/loss ratio calculation?
The win/loss ratio formula divides the number of won deals by the number of lost deals:
Win/Loss Ratio = Number of Won Deals ÷ Number of Lost Deals
For example, if you won 30 deals and lost 70, your win/loss ratio would be 0.43. Unlike win rate (which is a percentage), ratios above 1.0 indicate you're winning more deals than you're losing, while ratios below 1.0 mean you're losing more than winning.
How do I create a win rate calculator?
To build a basic sales win rate calculator:
Track won opportunities and total closed opportunities in your CRM
Create a spreadsheet with formulas to calculate:
Overall win rate
Win rate by rep
Win rate by product/service
Win rate by customer segment
Win rate by deal size
Update the data monthly and track trends over time
For a more sophisticated approach, use Forecastio's free win rate calculator that automatically pulls data from your CRM and provides benchmarking against industry standards.
What affects sales win rate most?
Based on our analysis of thousands of sales opportunities, the five factors that most significantly impact sales win rate are:
Speed to respond –– 35% higher win rates with rapid response times
Multi-stakeholder engagement –– 45% higher win rates with multiple decision-makers involved early
Technical validation –– 100% higher win rates with early technical discussions
Sales process adherence –– 27% higher win rates when following defined processes
Time in stage –– 70% lower win rates for deals that stay in the proposal stage beyond 21 days
Addressing these factors can dramatically improve your overall conversion performance.
Share:


