

Essential B2B Sales KPIs & Metrics: Complete Guide for 2026

Dmytro Chervonyi
CMO at Forecastio
Last updated
Reading time
10 min
Share:
Share
Track most important sales metrics in real-time

What is KPI in Sales? Understanding Sales Performance Indicators
KPI meaning in sales: Sales Key Performance Indicators (KPIs) are quantifiable metrics that measure the effectiveness and efficiency of your sales team's activities. These sales performance indicators provide the data foundation for making informed decisions, coaching teams, and driving consistent revenue growth.
Understanding what KPIs are in sales is crucial for any B2B organization serious about scalable growth. Sales KPIs differ from general business metrics by focusing specifically on activities and outcomes that directly impact revenue generation.
Why Sales KPIs and Metrics Are Critical for B2B Success
Strategic Alignment: Sales KPIs ensure every activity supports broader business objectives, from market expansion to customer acquisition cost optimization.
Performance Visibility: Key performance indicators for sales provide real-time insights into individual and team productivity, enabling proactive management rather than reactive problem-solving.
Predictive Planning: The right sales metrics enable accurate forecasting, better resource allocation, and strategic decision-making based on reliable data patterns.
Competitive Advantage: B2B sales teams using comprehensive KPI tracking consistently outperform competitors who rely on intuition or incomplete data.
See how Forecastio transforms your KPI tracking →
What Are the Most Important Sales KPIs?
While companies track dozens of sales metrics, a small group of KPIs typically has the greatest impact on revenue growth, forecasting accuracy, and sales performance management.
The most important sales KPIs for B2B teams include:
Win Rate
Sales Cycle Length
Average Deal Size
Pipeline Coverage Ratio
Sales Velocity
Forecast Accuracy
Quota Attainment
Customer Acquisition Cost (CAC)
Together, these KPIs help sales leaders measure pipeline quality, identify performance bottlenecks, improve forecasting accuracy, and make better revenue decisions.
5 Types of B2B Sales KPIs and Metrics
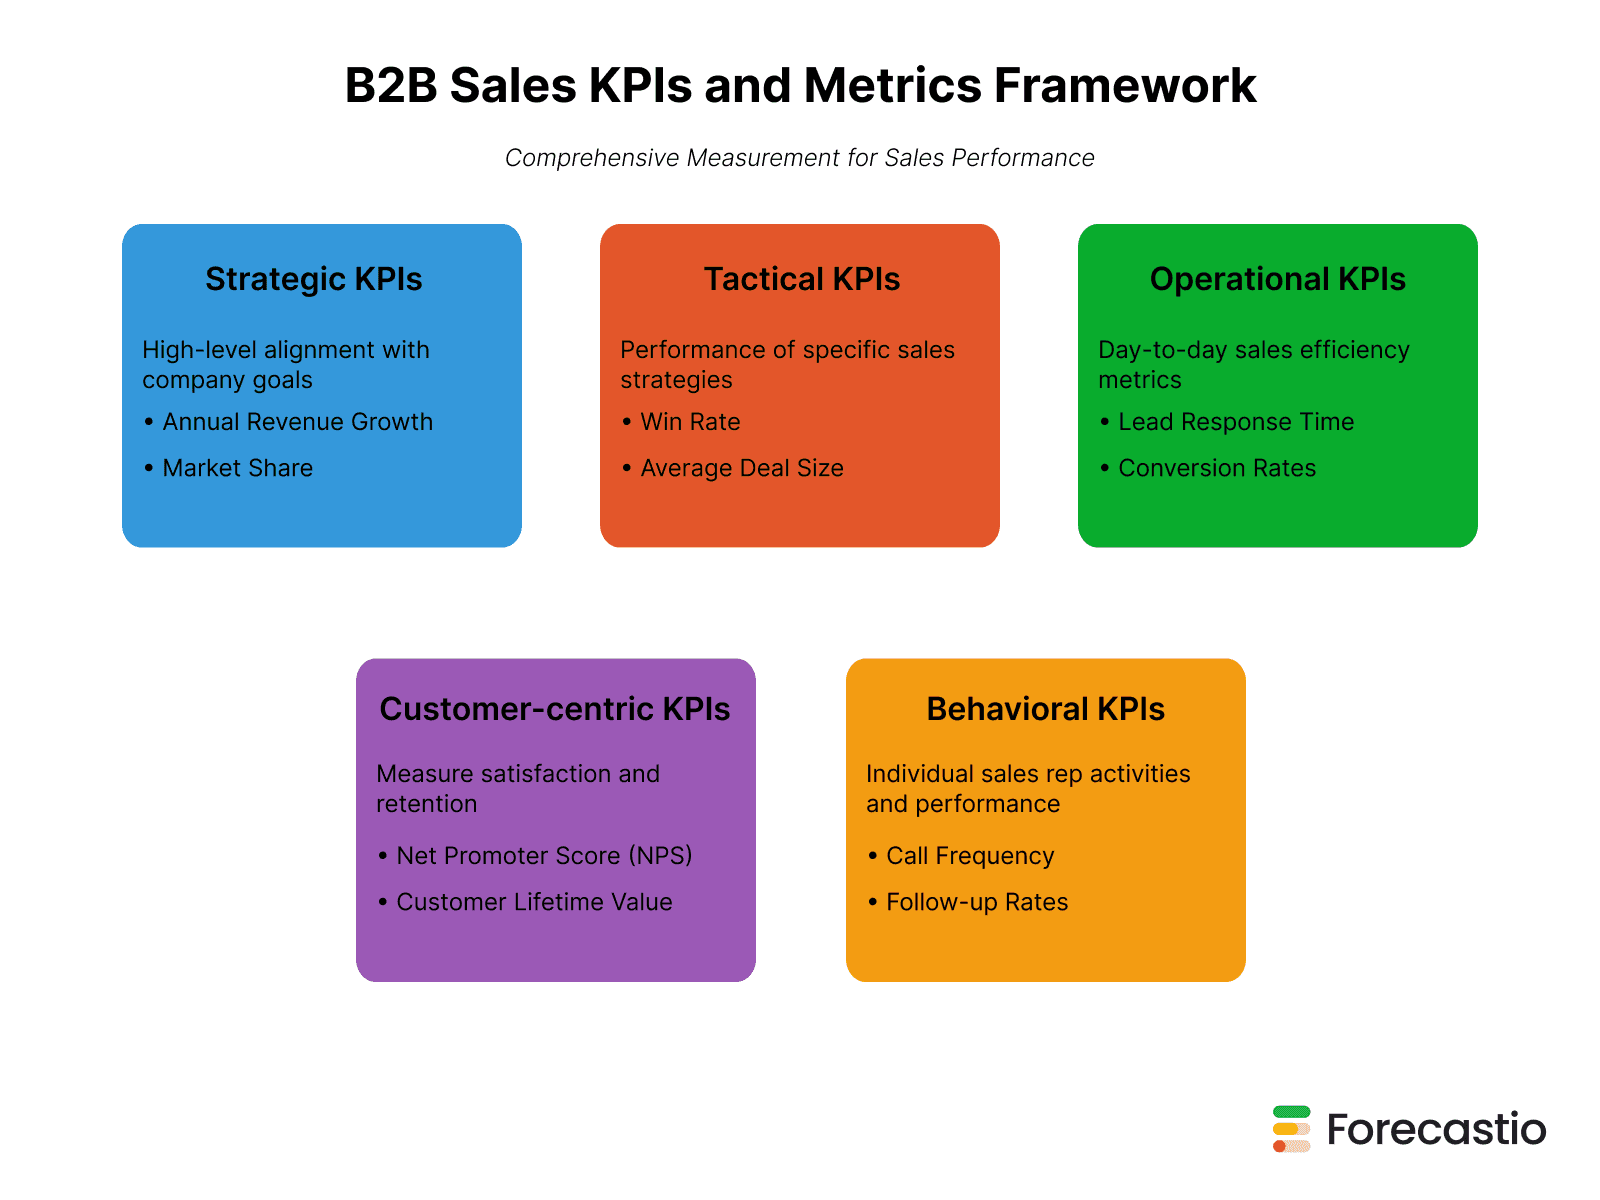
1. Strategic Sales KPIs
Definition: High-level sales performance indicators that align directly with company goals and long-term strategic plans.
Key Metrics:
Annual Revenue Growth
Market Share Expansion
Customer Lifetime Value (CLV)
Customer Acquisition Cost (CAC)
Importance: These KPIs serve as north stars for sales teams, ensuring activities drive long-term business objectives like revenue targets and market expansion goals.
2. Tactical Sales KPIs
Definition: Mid-level indicators measuring the performance of specific sales strategies and methodologies.
Key Metrics:
Average Deal Size
Conversion Rates by Stage
Importance: Tactical KPIs help sales managers optimize processes and methodologies to achieve strategic outcomes while enhancing overall sales productivity.
3. Sales Operations KPIs
Definition: Metrics focused on day-to-day sales efficiency and operational effectiveness.
Key Metrics:
Lead Response Time
Activity-to-Outcome Ratios
Sales Team Productivity
Importance: These sales efficiency metrics identify opportunities to streamline operations, reduce costs, and improve overall B2B sales cycle efficiency.
4. Sales Rep Performance KPIs
Definition: Individual-level metrics tracking specific sales rep activities and outcomes.
Key Metrics:
Calls Per Day
Meetings Scheduled
Proposals Sent
Importance: Activity-based KPIs enable personalized coaching, performance improvement plans, and recognition of top performers.
5. Customer Success KPIs
Definition: Metrics measuring customer engagement, satisfaction, and retention.
Key Metrics:
Net Promoter Score (NPS)
Expansion Revenue
Customer Health Scores
Importance: Understanding customer relationships helps maintain loyalty and identify upsell/cross-sell opportunities with existing customers.
Top 21 B2B Sales Metrics and KPIs for 2026
Core Revenue Metrics
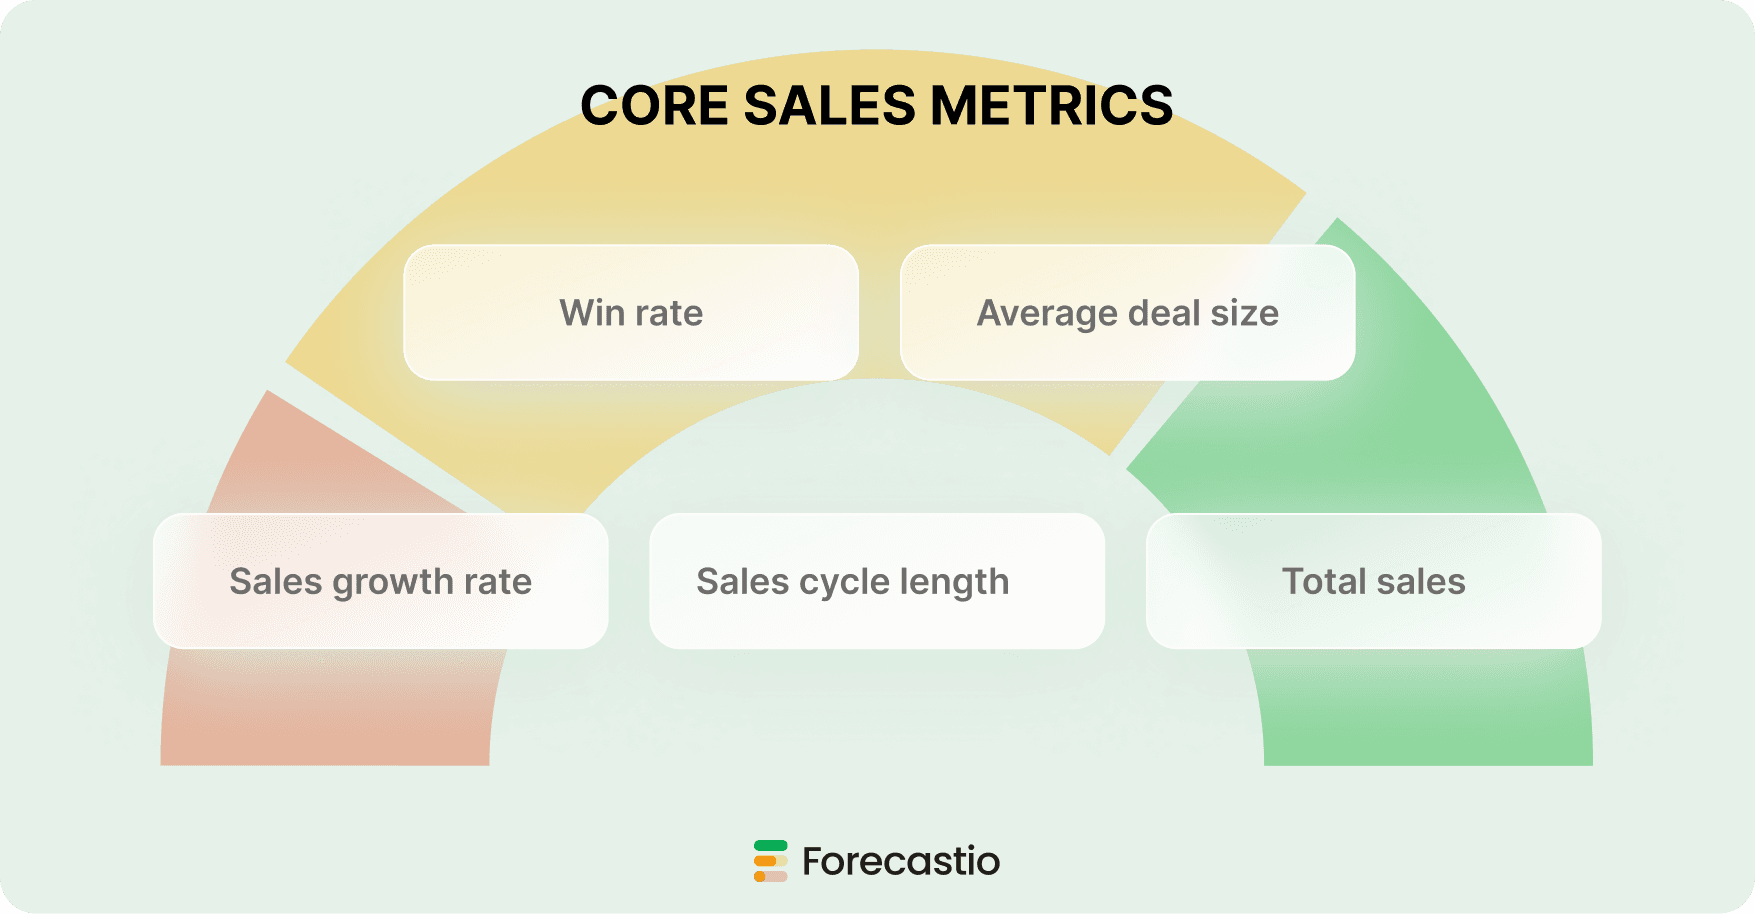
1. Win Rate
Formula: (Deals Won ÷ Total Closed Deals) × 100%
Benchmark: 20-30% for most B2B sales teams
Why It Matters: Win rate is the ultimate measure of sales effectiveness and product-market fit. A consistently high win rate indicates strong competitive positioning and effective sales processes.
Calculate your team's win rate →
2. Sales Cycle Length
Formula: Average days from opportunity creation to close
Benchmark: 3-6 months for most B2B sales
Why It Matters: Shorter sales cycles improve cash flow and enable more predictable revenue forecasting. Track by deal size and customer segment for deeper insights.
3. Average Deal Size
Formula: Total Revenue ÷ Number of Deals Closed
Benchmark: Varies by industry and sales model
Why It Matters: Larger deal sizes typically indicate better qualification, value selling, and strategic account management.
4. Sales Growth Rate
Formula: ((Current Period Sales - Previous Period Sales) ÷ Previous Period Sales) × 100%
Benchmark: 15-25% annual growth for healthy B2B companies
Why It Matters: Consistent growth indicates effective sales execution and market expansion capabilities.
Track your growth rate automatically →
5. Total Sales Revenue
Formula: Sum of all closed deals in a specific period
Why It Matters: The fundamental measure of sales team performance and company financial health.
Pipeline and Opportunity Metrics
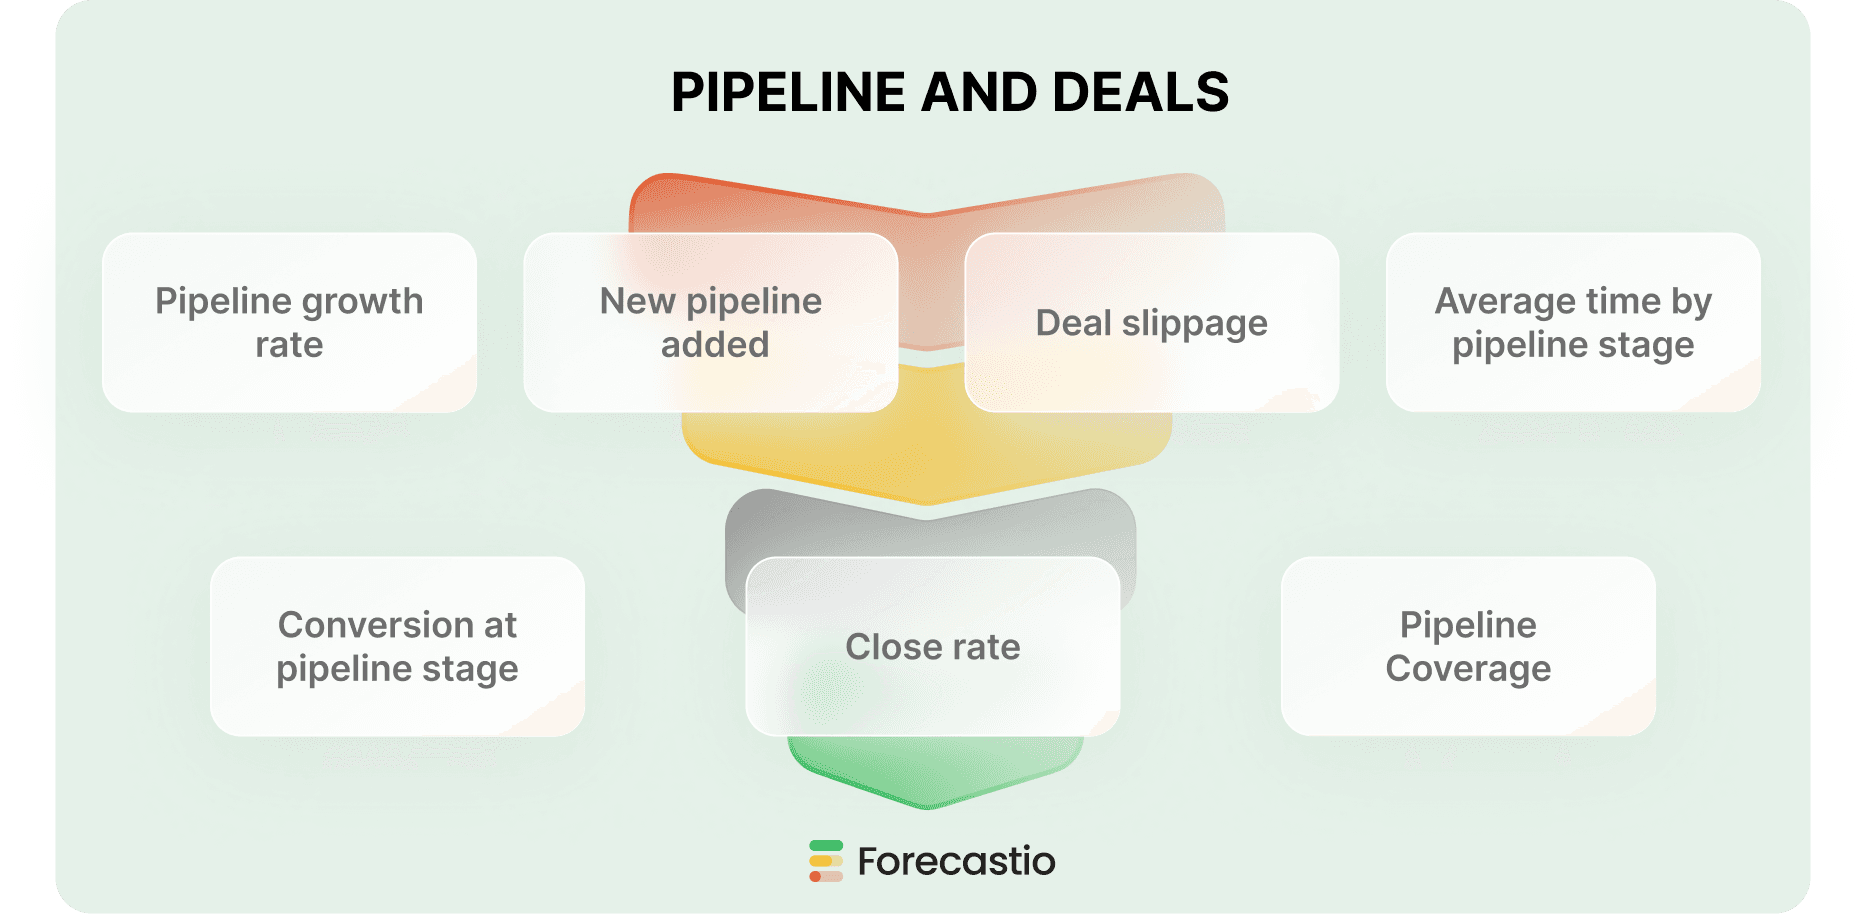
6. Pipeline Coverage Ratio
Formula: Total Pipeline Value ÷ Sales Quota
Benchmark: 3-4x quota coverage
Why It Matters: Indicates whether you have sufficient opportunities to hit revenue targets. Insufficient coverage signals need for increased prospecting.
Check your pipeline coverage →
7. Pipeline Growth Rate
Formula: ((Current Pipeline Value - Previous Pipeline Value) ÷ Previous Pipeline Value) × 100%
Why It Matters: Positive pipeline growth indicates healthy lead generation and opportunity creation.
8. New Pipeline Added
Formula: Sum of new opportunity values added in a period
Why It Matters: Measures the effectiveness of marketing and prospecting activities in generating qualified opportunities.
9. Close Rate
Formula: (Closed Won Deals ÷ Total Pipeline Opportunities) × 100%
Benchmark: 15-25% for most B2B sales funnels
Why It Matters: Indicates overall sales funnel efficiency and closing effectiveness.
10. Deal Slippage Rate
Formula: (Deals Moved Past Original Close Date ÷ Total Deals Forecast) × 100%
Benchmark: Less than 20%
Why It Matters: High slippage rates indicate poor qualification or unrealistic forecasting.
11. Conversion Rate by Pipeline Stage
Formula: (Opportunities Advanced ÷ Opportunities in Stage) × 100%
Why It Matters: Identifies bottlenecks and helps optimize sales process efficiency.
12. Average Time in Pipeline Stage
Formula: Total days in stage ÷ number of deals
Why It Matters: Reveals where deals get stuck and helps identify process improvement opportunities.
Team Performance Metrics
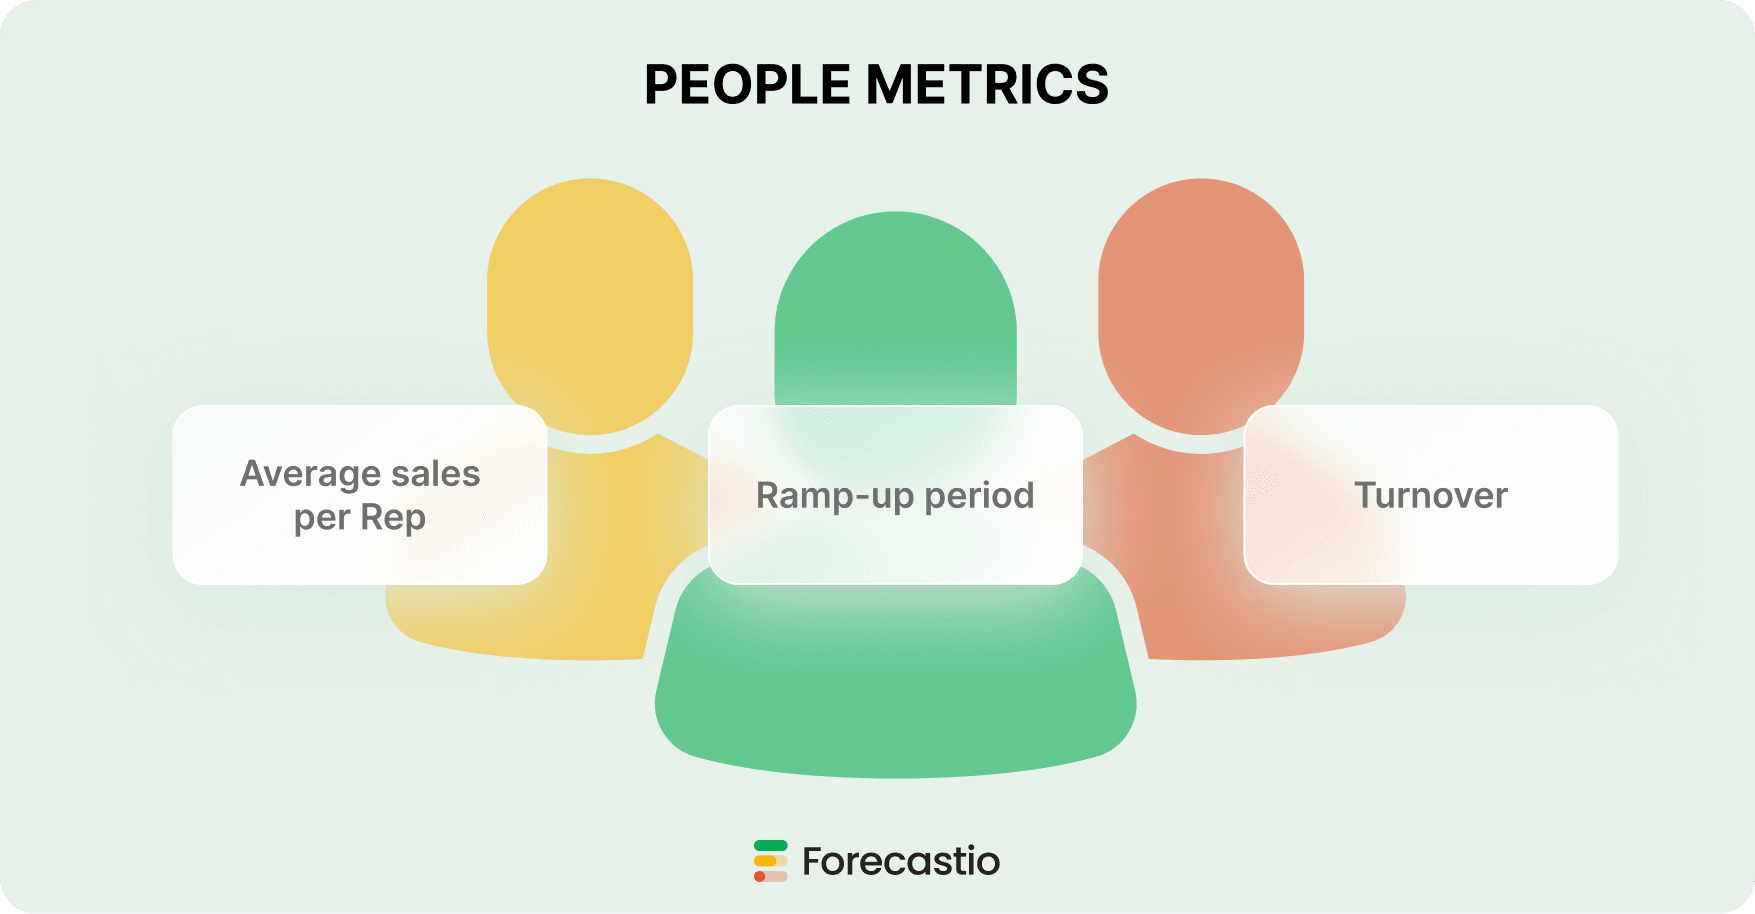
13. Average Sales per Rep
Formula: Total Sales ÷ Number of Sales Reps
Why It Matters: Measures individual productivity and helps with resource allocation and territory planning.
14. Sales Rep Ramp-up Time
Formula: Average days from hire to full quota achievement
Benchmark: 3-6 months for most B2B sales roles
Why It Matters: Shorter ramp times reduce cost per hire and accelerate revenue contribution.
15. Sales Team Turnover Rate
Formula: (Number of Departures ÷ Total Sales Reps) × 100%
Benchmark: Less than 15% annually
Why It Matters: High turnover disrupts sales operations and indicates potential culture or compensation issues.
Advanced Performance Metrics
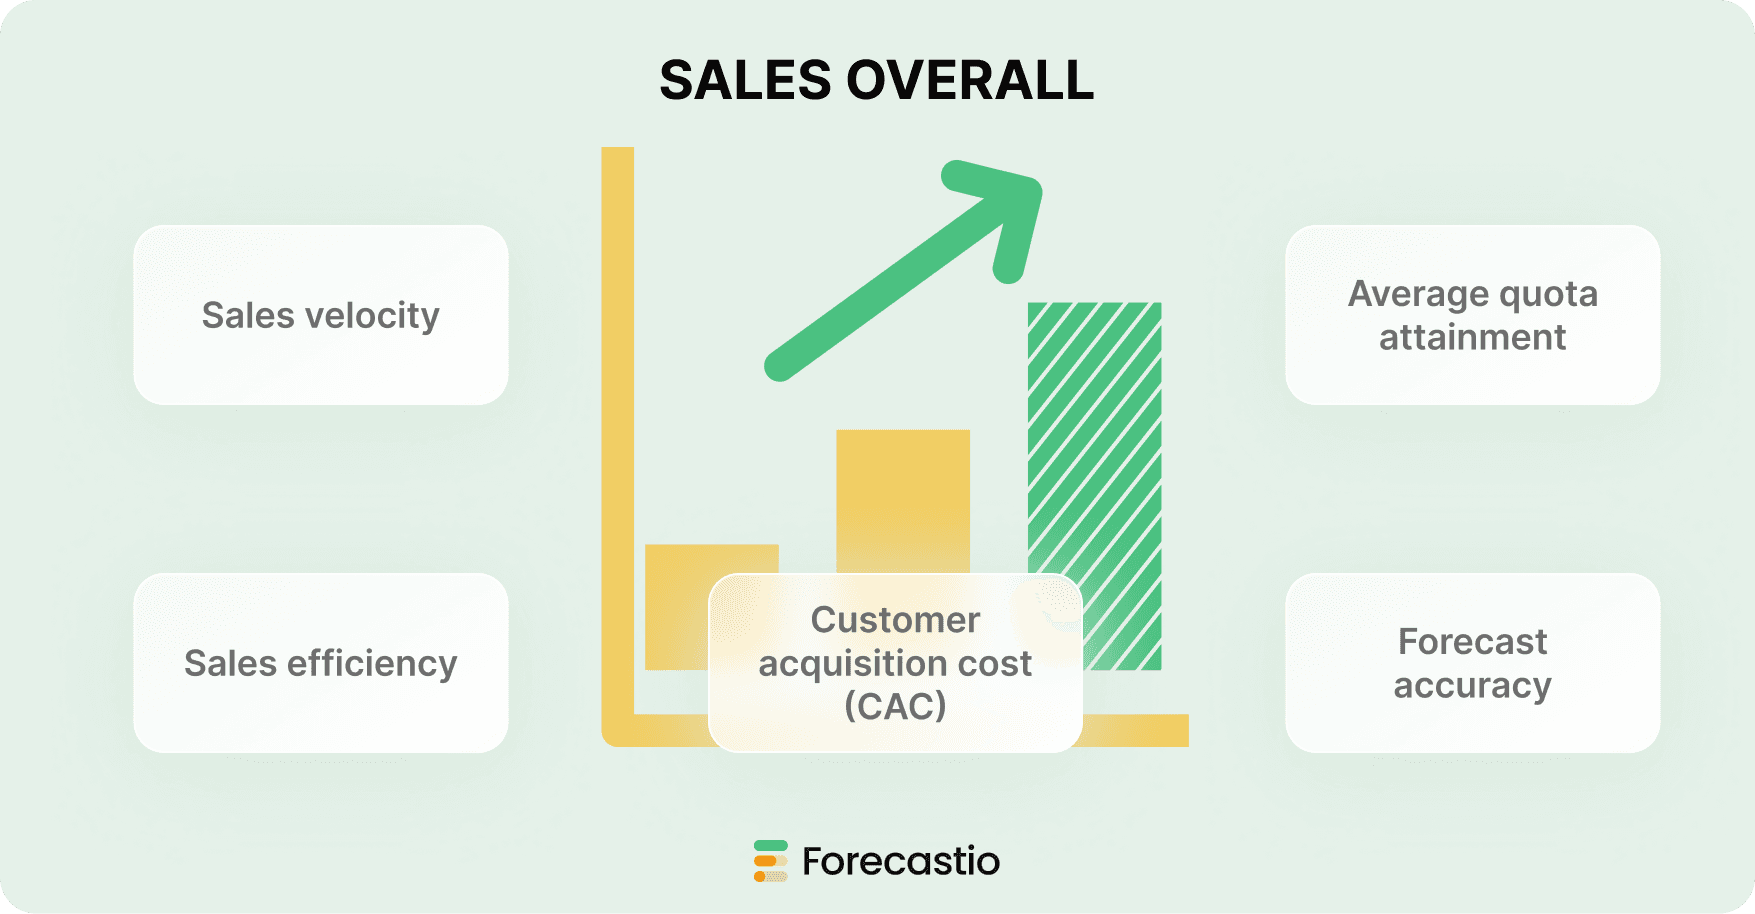
16. Sales Velocity
Formula: (Number of Opportunities × Win Rate × Average Deal Size) ÷ Sales Cycle Length
Why It Matters: Measures how quickly your team converts opportunities into revenue.
Calculate your sales velocity →
17. Sales Efficiency Ratio
Formula: Total Sales Revenue ÷ Total Sales Expenses
Benchmark: 3:1 or higher
Why It Matters: Indicates how effectively resources generate revenue.
Calculate your sales efficiency →
18. Customer Acquisition Cost (CAC)
Formula: (Sales + Marketing Expenses) ÷ Number of New Customers
Why It Matters: Critical for evaluating the profitability of customer acquisition strategies.
19. Quota Attainment Rate
Formula: (Total Sales ÷ Total Quota) × 100%
Benchmark: 85-100% team average
Why It Matters: Indicates overall sales team effectiveness and quota setting accuracy.
20. Forecast Accuracy
Formula: [1 - |Forecasted Sales - Actual Sales| ÷ Actual Sales] × 100%
Benchmark: 90%+ accuracy
Why It Matters: Accurate forecasting enables better business planning and resource allocation.
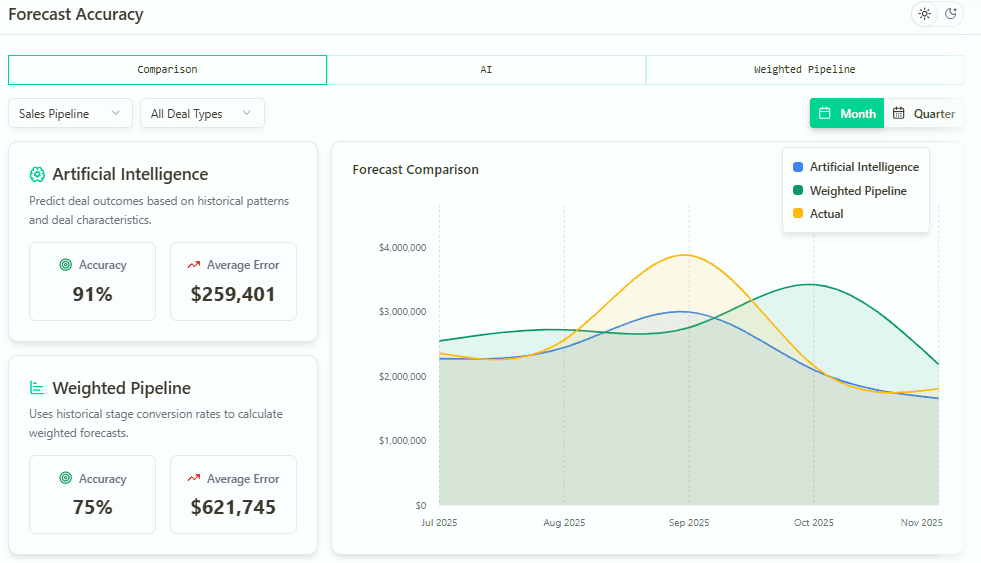
Tracking Forecast Accuracy with Forecastio
Check your forecast accuracy →
21. Pipeline Health Ratio
Formula: (Value of healthy, active deals ÷ total pipeline value) × 100
Healthy deals exclude stalled, inactive, or overdue opportunities based on defined criteria.
Benchmark: 70–80% for well-managed B2B sales pipelines
Why It Matters: A high Pipeline Health Ratio indicates that most opportunities are actively progressing and realistically closable. This KPI improves forecast reliability, helps sales leaders detect hidden pipeline risk early, and prevents revenue projections from being inflated by stalled or inactive deals. Track it regularly alongside pipeline coverage and stage conversion rates for accurate sales forecasting.
How to Choose the Right Sales KPIs for Your Team
Alignment with Business Objectives
Your sales KPIs must directly support company strategic goals. If market expansion is a priority, focus on metrics like new territory performance and customer acquisition. For profitability focus, emphasize efficiency metrics and deal size optimization.
Balanced Scorecard Approach
Leading Indicators: Activity metrics that predict future results (calls made, meetings scheduled)
Lagging Indicators: Outcome metrics that show past performance (revenue, win rate)
Balance both types: Use leading indicators for coaching and course correction, lagging indicators for performance evaluation.
Team Size and Maturity Considerations
Startup Sales Teams (1-5 reps):
Focus on 5-7 core metrics
Emphasize pipeline coverage and activity metrics
Track individual performance closely
Growing Teams (6-25 reps):
Add efficiency and process metrics
Introduce manager-level dashboards
Begin benchmarking against industry standards
Enterprise Teams (25+ reps):
Implement comprehensive KPI frameworks
Add predictive analytics and advanced metrics
Focus on territory and segment performance
Balance Between Leading and Lagging KPIs
When choosing sales KPIs, it is important to maintain a balance between leading and lagging sales indicators.
Leading KPIs, such as meetings booked or pipeline created, help predict future performance and enable early action. Lagging KPIs, such as win rate and revenue growth rate reflect final outcomes.
A balanced mix ensures that your team tracks both activities and results, improving control over performance and making revenue more predictable.
Implementation Best Practices
Involve Key Stakeholders: Ensure cross-departmental alignment on KPI definitions and targets.
Define Clear Metrics: Eliminate ambiguity with precise calculations and data sources.
Set Realistic Targets: Base goals on historical performance and industry benchmarks.
Regular Review Cycles: Monthly tactical reviews, quarterly strategic assessments.
Ensure Data Quality: Invest in systems and processes that provide accurate, timely data.
Get personalized KPI recommendations →
B2B Sales KPI Benchmarks and Industry Standards
Win Rate Benchmarks by Industry
Industry | Average Win Rate | Top Performer |
|---|---|---|
SaaS/Technology | 15-25% | 30%+ |
Financial Services | 10-20% | 25%+ |
Manufacturing | 20-30% | 35%+ |
Healthcare | 12-22% | 27%+ |
Professional Services | 25-35% | 40%+ |
Sales Cycle Benchmarks
Deal Size | Average Cycle | Best-in-Class |
|---|---|---|
$10K-$50K | 1-3 months | 1-2 months |
$50K-$100K | 3-6 months | 2-4 months |
$100K-$500K | 6-12 months | 4-8 months |
$500K+ | 12-18 months | 8-12 months |
Pipeline Coverage Guidelines
Minimum Coverage: 3x quota for consistent goal achievement
Optimal Coverage: 4-5x quota for growth and buffer
Early-Stage Reps: 5-6x coverage while building experience
Source: Based on analysis of 500+ B2B sales teams
Sales KPI Dashboards and Tracking Tools
Essential Dashboard Components
Executive Summary View:
Revenue vs. Goal
Pipeline Health
Team Performance
Forecast Accuracy
Manager Daily View:
Individual Rep Performance
Pipeline Movement
Activity Metrics
Risk Alerts
Rep Personal View:
Personal Goals vs. Actuals
Activity Tracking
Next Best Actions
Commission Tracking
Why HubSpot Users Choose Forecastio for KPI Tracking
While HubSpot provides solid basic reporting, Forecastio transforms your CRM data into actionable sales intelligence:
Advanced KPI Automation: Automatically calculates 20+ critical sales metrics
Real-time Alerts: Get notified when KPIs fall outside target ranges
Predictive Insights: AI-powered forecasting improves accuracy by 35%
Custom Benchmarking: Compare your metrics against industry standards
One-Click Reporting: Generate executive-ready reports in seconds
Integration Benefits:
5-minute setup with HubSpot
No data migration required
Preserves existing workflows
Enhances rather than replaces CRM
See Forecastio's KPI tracking in action →
Common Sales KPIs Mistakes to Avoid
Tracking Too Many Metrics
Problem: Information overload leads to analysis paralysis and diluted focus.
Solution: Start with 5-7 core KPIs that directly impact revenue. Add complexity gradually as processes mature.
Ignoring Leading Indicators
Problem: Focusing only on outcome metrics provides no early warning system.
Solution: Balance outcome metrics (revenue, win rate) with activity metrics (calls, meetings, proposals).
Inconsistent Definitions
Problem: Different teams calculating the same metric differently creates confusion and misalignment.
Solution: Document clear definitions, data sources, and calculation methods for every KPI.
Setting Unrealistic Targets
Problem: Impossible goals demoralize teams and reduce credibility.
Solution: Base targets on historical performance, industry benchmarks, and market conditions.
Poor Data Quality
Problem: Inaccurate data leads to wrong decisions and lost confidence in metrics.
Solution: Invest in data governance, CRM hygiene, and automated validation processes.
Advanced Sales Analytics and AI-Powered KPIs
Predictive KPI Modeling
Modern sales teams use AI to predict future performance based on current activities:
Deal Scoring: Predict probability of close for each opportunity
Rep Performance Forecasting: Identify reps likely to miss quota
Pipeline Health Analysis: Detect early warning signs of pipeline problems
Customer Churn Prediction: Identify at-risk accounts for proactive intervention
Revenue Leakage Rate: Quantify the amount and speed of revenue loss across your pipeline.
Conversation Intelligence Metrics
Track the quality of sales interactions:
Talk-to-Listen Ratio: Optimal range 43-57% rep talk time
Discovery Question Rate: Top performers ask 11-14 questions per call
Next Steps Confirmation: Best reps confirm next steps 90%+ of the time
Competitive Mentions: Track win rates when competitors are discussed
Revenue Intelligence KPIs
Advanced metrics for sophisticated sales operations:
Pipeline Acceleration: How activities impact deal velocity
Cross-Sell/Upsell Rates: Revenue expansion from existing customers
Deal Compression: Reducing sales cycle without sacrificing deal size
Territory Optimization: Revenue per territory and coverage analysis
Explore advanced KPI tracking with Forecastio →
Implementing Sales KPIs: Step-by-Step Guide
Phase 1: Foundation (Weeks 1-2)
Define Objectives: Align KPI strategy with business goals
Choose Core Metrics: Select 5-7 essential KPIs to start
Establish Baselines: Analyze historical performance for benchmarking
Set Initial Targets: Create realistic but challenging goals
Phase 2: System Setup (Weeks 3-4)
Configure Tracking: Set up CRM fields and automation rules
Create Dashboards: Build manager and rep-level views
Train Team: Ensure everyone understands definitions and expectations
Test Accuracy: Validate data quality and calculation methods
Phase 3: Optimization (Weeks 5-8)
Monitor Performance: Track actual vs. target performance
Gather Feedback: Collect input from users and stakeholders
Refine Processes: Adjust based on real-world usage
Scale Gradually: Add additional metrics as processes mature
Phase 4: Advanced Analytics (Weeks 9-12)
Add Predictive Elements: Implement forecasting and risk detection
Benchmark Externally: Compare against industry standards
Automate Insights: Set up alerts and automated reporting
Continuous Improvement: Regular review and optimization cycles
Get implementation support from Forecastio experts →
Sales KPI ROI Calculator
Quantifying the Impact of Better KPI Tracking
Organizations implementing comprehensive KPI tracking typically see:
Revenue Impact:
15-25% improvement in forecast accuracy
10-20% increase in win rates
20-30% reduction in sales cycle length
25-35% improvement in quota attainment
Operational Benefits:
40% reduction in reporting time
60% faster identification of at-risk deals
30% improvement in coaching effectiveness
50% better resource allocation decisions
ROI Calculation Example
Annual Revenue: $10M
Team Size: 20 reps
Current Win Rate: 20%
With Improved KPIs:
Win Rate Improvement: 20% → 25% (+25% relative)
Revenue Impact: $10M × 25% = $2.5M additional revenue
Software Investment: $50K annually
ROI: 4,900%
Calculate your potential ROI →
Frequently Asked Questions About Sales KPIs
What are the 5 key performance indicators in sales?
The five most critical sales KPIs that every B2B team should track are:
Win Rate - Percentage of opportunities that close successfully
Sales Cycle Length - Time from first contact to deal closure
Pipeline Coverage - Pipeline value relative to quota requirements
Average Deal Size - Revenue per closed opportunity
Forecast Accuracy - How well predictions match actual results
What does KPI mean in sales?
KPI in sales stands for Key Performance Indicator - a quantifiable metric that measures the effectiveness of sales activities and outcomes. Sales KPIs provide objective data for evaluating individual and team performance, identifying improvement opportunities, and making strategic decisions.
What are good sales metrics to track?
The best sales metrics to track depend on your business goals, but generally include:
Activity Metrics: Calls, emails, meetings, proposals
Pipeline Metrics: Coverage, velocity, conversion rates
Outcome Metrics: Revenue, win rate, deal size
Efficiency Metrics: Cost per acquisition, sales cycle time
Quality Metrics: Customer satisfaction, retention rates
How often should sales KPIs be reviewed?
Daily: Activity metrics and pipeline health for individual reps
Weekly: Team performance and forecast updates for managers
Monthly: Comprehensive performance reviews and trend analysis
Quarterly: Strategic KPI assessment and target adjustments
What's the difference between sales metrics and KPIs?
Sales Metrics are any quantifiable measurements of sales activities or outcomes.
Sales KPIs are the specific, most important metrics that directly relate to business objectives and drive strategic decisions. All KPIs are metrics, but not all metrics are KPIs.
How many sales KPIs should we track?
Start with 5-7 core KPIs to avoid overwhelming your team. You can expand to 15-20 metrics as your processes mature and data quality improves. Focus on metrics that are actionable and directly impact revenue.
Conclusion: Transform Your Sales Performance with Strategic KPIs
Effective B2B sales KPI tracking is not just about collecting data—it's about creating a culture of accountability, continuous improvement, and data-driven decision making. The sales teams that consistently exceed their targets are those that understand their metrics, act on insights, and continuously optimize their approach.
Key Takeaways:
Focus on 5-7 core KPIs initially, expanding thoughtfully over time
Balance leading indicators (activities) with lagging indicators (outcomes)
Ensure data quality and consistent definitions across your organization
Use KPIs for coaching and process improvement, not just performance evaluation
Invest in tools that automate tracking and provide actionable insights
The competitive advantage goes to sales organizations that can measure what matters, identify trends early, and adapt quickly to changing conditions. By implementing the KPIs and best practices outlined in this guide, you'll build a sales operation that not only hits targets consistently but creates predictable, scalable growth.
Ready to revolutionize your sales KPI tracking?
Book a demo with Forecastio → and see how our AI-powered platform transforms your HubSpot data into actionable sales intelligence. Join hundreds of B2B teams who've improved their forecast accuracy by 35% and increased quota attainment by 28%.
Want to dive deeper into sales performance optimization? Explore our comprehensive guides on sales forecasting, pipeline management, and revenue operations.
What is KPI in Sales? Understanding Sales Performance Indicators
KPI meaning in sales: Sales Key Performance Indicators (KPIs) are quantifiable metrics that measure the effectiveness and efficiency of your sales team's activities. These sales performance indicators provide the data foundation for making informed decisions, coaching teams, and driving consistent revenue growth.
Understanding what KPIs are in sales is crucial for any B2B organization serious about scalable growth. Sales KPIs differ from general business metrics by focusing specifically on activities and outcomes that directly impact revenue generation.
Why Sales KPIs and Metrics Are Critical for B2B Success
Strategic Alignment: Sales KPIs ensure every activity supports broader business objectives, from market expansion to customer acquisition cost optimization.
Performance Visibility: Key performance indicators for sales provide real-time insights into individual and team productivity, enabling proactive management rather than reactive problem-solving.
Predictive Planning: The right sales metrics enable accurate forecasting, better resource allocation, and strategic decision-making based on reliable data patterns.
Competitive Advantage: B2B sales teams using comprehensive KPI tracking consistently outperform competitors who rely on intuition or incomplete data.
See how Forecastio transforms your KPI tracking →
What Are the Most Important Sales KPIs?
While companies track dozens of sales metrics, a small group of KPIs typically has the greatest impact on revenue growth, forecasting accuracy, and sales performance management.
The most important sales KPIs for B2B teams include:
Win Rate
Sales Cycle Length
Average Deal Size
Pipeline Coverage Ratio
Sales Velocity
Forecast Accuracy
Quota Attainment
Customer Acquisition Cost (CAC)
Together, these KPIs help sales leaders measure pipeline quality, identify performance bottlenecks, improve forecasting accuracy, and make better revenue decisions.
5 Types of B2B Sales KPIs and Metrics
1. Strategic Sales KPIs
Definition: High-level sales performance indicators that align directly with company goals and long-term strategic plans.
Key Metrics:
Annual Revenue Growth
Market Share Expansion
Customer Lifetime Value (CLV)
Customer Acquisition Cost (CAC)
Importance: These KPIs serve as north stars for sales teams, ensuring activities drive long-term business objectives like revenue targets and market expansion goals.
2. Tactical Sales KPIs
Definition: Mid-level indicators measuring the performance of specific sales strategies and methodologies.
Key Metrics:
Average Deal Size
Conversion Rates by Stage
Importance: Tactical KPIs help sales managers optimize processes and methodologies to achieve strategic outcomes while enhancing overall sales productivity.
3. Sales Operations KPIs
Definition: Metrics focused on day-to-day sales efficiency and operational effectiveness.
Key Metrics:
Lead Response Time
Activity-to-Outcome Ratios
Sales Team Productivity
Importance: These sales efficiency metrics identify opportunities to streamline operations, reduce costs, and improve overall B2B sales cycle efficiency.
4. Sales Rep Performance KPIs
Definition: Individual-level metrics tracking specific sales rep activities and outcomes.
Key Metrics:
Calls Per Day
Meetings Scheduled
Proposals Sent
Importance: Activity-based KPIs enable personalized coaching, performance improvement plans, and recognition of top performers.
5. Customer Success KPIs
Definition: Metrics measuring customer engagement, satisfaction, and retention.
Key Metrics:
Net Promoter Score (NPS)
Expansion Revenue
Customer Health Scores
Importance: Understanding customer relationships helps maintain loyalty and identify upsell/cross-sell opportunities with existing customers.
Top 21 B2B Sales Metrics and KPIs for 2026
Core Revenue Metrics
1. Win Rate
Formula: (Deals Won ÷ Total Closed Deals) × 100%
Benchmark: 20-30% for most B2B sales teams
Why It Matters: Win rate is the ultimate measure of sales effectiveness and product-market fit. A consistently high win rate indicates strong competitive positioning and effective sales processes.
Calculate your team's win rate →
2. Sales Cycle Length
Formula: Average days from opportunity creation to close
Benchmark: 3-6 months for most B2B sales
Why It Matters: Shorter sales cycles improve cash flow and enable more predictable revenue forecasting. Track by deal size and customer segment for deeper insights.
3. Average Deal Size
Formula: Total Revenue ÷ Number of Deals Closed
Benchmark: Varies by industry and sales model
Why It Matters: Larger deal sizes typically indicate better qualification, value selling, and strategic account management.
4. Sales Growth Rate
Formula: ((Current Period Sales - Previous Period Sales) ÷ Previous Period Sales) × 100%
Benchmark: 15-25% annual growth for healthy B2B companies
Why It Matters: Consistent growth indicates effective sales execution and market expansion capabilities.
Track your growth rate automatically →
5. Total Sales Revenue
Formula: Sum of all closed deals in a specific period
Why It Matters: The fundamental measure of sales team performance and company financial health.
Pipeline and Opportunity Metrics
6. Pipeline Coverage Ratio
Formula: Total Pipeline Value ÷ Sales Quota
Benchmark: 3-4x quota coverage
Why It Matters: Indicates whether you have sufficient opportunities to hit revenue targets. Insufficient coverage signals need for increased prospecting.
Check your pipeline coverage →
7. Pipeline Growth Rate
Formula: ((Current Pipeline Value - Previous Pipeline Value) ÷ Previous Pipeline Value) × 100%
Why It Matters: Positive pipeline growth indicates healthy lead generation and opportunity creation.
8. New Pipeline Added
Formula: Sum of new opportunity values added in a period
Why It Matters: Measures the effectiveness of marketing and prospecting activities in generating qualified opportunities.
9. Close Rate
Formula: (Closed Won Deals ÷ Total Pipeline Opportunities) × 100%
Benchmark: 15-25% for most B2B sales funnels
Why It Matters: Indicates overall sales funnel efficiency and closing effectiveness.
10. Deal Slippage Rate
Formula: (Deals Moved Past Original Close Date ÷ Total Deals Forecast) × 100%
Benchmark: Less than 20%
Why It Matters: High slippage rates indicate poor qualification or unrealistic forecasting.
11. Conversion Rate by Pipeline Stage
Formula: (Opportunities Advanced ÷ Opportunities in Stage) × 100%
Why It Matters: Identifies bottlenecks and helps optimize sales process efficiency.
12. Average Time in Pipeline Stage
Formula: Total days in stage ÷ number of deals
Why It Matters: Reveals where deals get stuck and helps identify process improvement opportunities.
Team Performance Metrics
13. Average Sales per Rep
Formula: Total Sales ÷ Number of Sales Reps
Why It Matters: Measures individual productivity and helps with resource allocation and territory planning.
14. Sales Rep Ramp-up Time
Formula: Average days from hire to full quota achievement
Benchmark: 3-6 months for most B2B sales roles
Why It Matters: Shorter ramp times reduce cost per hire and accelerate revenue contribution.
15. Sales Team Turnover Rate
Formula: (Number of Departures ÷ Total Sales Reps) × 100%
Benchmark: Less than 15% annually
Why It Matters: High turnover disrupts sales operations and indicates potential culture or compensation issues.
Advanced Performance Metrics
16. Sales Velocity
Formula: (Number of Opportunities × Win Rate × Average Deal Size) ÷ Sales Cycle Length
Why It Matters: Measures how quickly your team converts opportunities into revenue.
Calculate your sales velocity →
17. Sales Efficiency Ratio
Formula: Total Sales Revenue ÷ Total Sales Expenses
Benchmark: 3:1 or higher
Why It Matters: Indicates how effectively resources generate revenue.
Calculate your sales efficiency →
18. Customer Acquisition Cost (CAC)
Formula: (Sales + Marketing Expenses) ÷ Number of New Customers
Why It Matters: Critical for evaluating the profitability of customer acquisition strategies.
19. Quota Attainment Rate
Formula: (Total Sales ÷ Total Quota) × 100%
Benchmark: 85-100% team average
Why It Matters: Indicates overall sales team effectiveness and quota setting accuracy.
20. Forecast Accuracy
Formula: [1 - |Forecasted Sales - Actual Sales| ÷ Actual Sales] × 100%
Benchmark: 90%+ accuracy
Why It Matters: Accurate forecasting enables better business planning and resource allocation.
Tracking Forecast Accuracy with Forecastio
Check your forecast accuracy →
21. Pipeline Health Ratio
Formula: (Value of healthy, active deals ÷ total pipeline value) × 100
Healthy deals exclude stalled, inactive, or overdue opportunities based on defined criteria.
Benchmark: 70–80% for well-managed B2B sales pipelines
Why It Matters: A high Pipeline Health Ratio indicates that most opportunities are actively progressing and realistically closable. This KPI improves forecast reliability, helps sales leaders detect hidden pipeline risk early, and prevents revenue projections from being inflated by stalled or inactive deals. Track it regularly alongside pipeline coverage and stage conversion rates for accurate sales forecasting.
How to Choose the Right Sales KPIs for Your Team
Alignment with Business Objectives
Your sales KPIs must directly support company strategic goals. If market expansion is a priority, focus on metrics like new territory performance and customer acquisition. For profitability focus, emphasize efficiency metrics and deal size optimization.
Balanced Scorecard Approach
Leading Indicators: Activity metrics that predict future results (calls made, meetings scheduled)
Lagging Indicators: Outcome metrics that show past performance (revenue, win rate)
Balance both types: Use leading indicators for coaching and course correction, lagging indicators for performance evaluation.
Team Size and Maturity Considerations
Startup Sales Teams (1-5 reps):
Focus on 5-7 core metrics
Emphasize pipeline coverage and activity metrics
Track individual performance closely
Growing Teams (6-25 reps):
Add efficiency and process metrics
Introduce manager-level dashboards
Begin benchmarking against industry standards
Enterprise Teams (25+ reps):
Implement comprehensive KPI frameworks
Add predictive analytics and advanced metrics
Focus on territory and segment performance
Balance Between Leading and Lagging KPIs
When choosing sales KPIs, it is important to maintain a balance between leading and lagging sales indicators.
Leading KPIs, such as meetings booked or pipeline created, help predict future performance and enable early action. Lagging KPIs, such as win rate and revenue growth rate reflect final outcomes.
A balanced mix ensures that your team tracks both activities and results, improving control over performance and making revenue more predictable.
Implementation Best Practices
Involve Key Stakeholders: Ensure cross-departmental alignment on KPI definitions and targets.
Define Clear Metrics: Eliminate ambiguity with precise calculations and data sources.
Set Realistic Targets: Base goals on historical performance and industry benchmarks.
Regular Review Cycles: Monthly tactical reviews, quarterly strategic assessments.
Ensure Data Quality: Invest in systems and processes that provide accurate, timely data.
Get personalized KPI recommendations →
B2B Sales KPI Benchmarks and Industry Standards
Win Rate Benchmarks by Industry
Industry | Average Win Rate | Top Performer |
|---|---|---|
SaaS/Technology | 15-25% | 30%+ |
Financial Services | 10-20% | 25%+ |
Manufacturing | 20-30% | 35%+ |
Healthcare | 12-22% | 27%+ |
Professional Services | 25-35% | 40%+ |
Sales Cycle Benchmarks
Deal Size | Average Cycle | Best-in-Class |
|---|---|---|
$10K-$50K | 1-3 months | 1-2 months |
$50K-$100K | 3-6 months | 2-4 months |
$100K-$500K | 6-12 months | 4-8 months |
$500K+ | 12-18 months | 8-12 months |
Pipeline Coverage Guidelines
Minimum Coverage: 3x quota for consistent goal achievement
Optimal Coverage: 4-5x quota for growth and buffer
Early-Stage Reps: 5-6x coverage while building experience
Source: Based on analysis of 500+ B2B sales teams
Sales KPI Dashboards and Tracking Tools
Essential Dashboard Components
Executive Summary View:
Revenue vs. Goal
Pipeline Health
Team Performance
Forecast Accuracy
Manager Daily View:
Individual Rep Performance
Pipeline Movement
Activity Metrics
Risk Alerts
Rep Personal View:
Personal Goals vs. Actuals
Activity Tracking
Next Best Actions
Commission Tracking
Why HubSpot Users Choose Forecastio for KPI Tracking
While HubSpot provides solid basic reporting, Forecastio transforms your CRM data into actionable sales intelligence:
Advanced KPI Automation: Automatically calculates 20+ critical sales metrics
Real-time Alerts: Get notified when KPIs fall outside target ranges
Predictive Insights: AI-powered forecasting improves accuracy by 35%
Custom Benchmarking: Compare your metrics against industry standards
One-Click Reporting: Generate executive-ready reports in seconds
Integration Benefits:
5-minute setup with HubSpot
No data migration required
Preserves existing workflows
Enhances rather than replaces CRM
See Forecastio's KPI tracking in action →
Common Sales KPIs Mistakes to Avoid
Tracking Too Many Metrics
Problem: Information overload leads to analysis paralysis and diluted focus.
Solution: Start with 5-7 core KPIs that directly impact revenue. Add complexity gradually as processes mature.
Ignoring Leading Indicators
Problem: Focusing only on outcome metrics provides no early warning system.
Solution: Balance outcome metrics (revenue, win rate) with activity metrics (calls, meetings, proposals).
Inconsistent Definitions
Problem: Different teams calculating the same metric differently creates confusion and misalignment.
Solution: Document clear definitions, data sources, and calculation methods for every KPI.
Setting Unrealistic Targets
Problem: Impossible goals demoralize teams and reduce credibility.
Solution: Base targets on historical performance, industry benchmarks, and market conditions.
Poor Data Quality
Problem: Inaccurate data leads to wrong decisions and lost confidence in metrics.
Solution: Invest in data governance, CRM hygiene, and automated validation processes.
Advanced Sales Analytics and AI-Powered KPIs
Predictive KPI Modeling
Modern sales teams use AI to predict future performance based on current activities:
Deal Scoring: Predict probability of close for each opportunity
Rep Performance Forecasting: Identify reps likely to miss quota
Pipeline Health Analysis: Detect early warning signs of pipeline problems
Customer Churn Prediction: Identify at-risk accounts for proactive intervention
Revenue Leakage Rate: Quantify the amount and speed of revenue loss across your pipeline.
Conversation Intelligence Metrics
Track the quality of sales interactions:
Talk-to-Listen Ratio: Optimal range 43-57% rep talk time
Discovery Question Rate: Top performers ask 11-14 questions per call
Next Steps Confirmation: Best reps confirm next steps 90%+ of the time
Competitive Mentions: Track win rates when competitors are discussed
Revenue Intelligence KPIs
Advanced metrics for sophisticated sales operations:
Pipeline Acceleration: How activities impact deal velocity
Cross-Sell/Upsell Rates: Revenue expansion from existing customers
Deal Compression: Reducing sales cycle without sacrificing deal size
Territory Optimization: Revenue per territory and coverage analysis
Explore advanced KPI tracking with Forecastio →
Implementing Sales KPIs: Step-by-Step Guide
Phase 1: Foundation (Weeks 1-2)
Define Objectives: Align KPI strategy with business goals
Choose Core Metrics: Select 5-7 essential KPIs to start
Establish Baselines: Analyze historical performance for benchmarking
Set Initial Targets: Create realistic but challenging goals
Phase 2: System Setup (Weeks 3-4)
Configure Tracking: Set up CRM fields and automation rules
Create Dashboards: Build manager and rep-level views
Train Team: Ensure everyone understands definitions and expectations
Test Accuracy: Validate data quality and calculation methods
Phase 3: Optimization (Weeks 5-8)
Monitor Performance: Track actual vs. target performance
Gather Feedback: Collect input from users and stakeholders
Refine Processes: Adjust based on real-world usage
Scale Gradually: Add additional metrics as processes mature
Phase 4: Advanced Analytics (Weeks 9-12)
Add Predictive Elements: Implement forecasting and risk detection
Benchmark Externally: Compare against industry standards
Automate Insights: Set up alerts and automated reporting
Continuous Improvement: Regular review and optimization cycles
Get implementation support from Forecastio experts →
Sales KPI ROI Calculator
Quantifying the Impact of Better KPI Tracking
Organizations implementing comprehensive KPI tracking typically see:
Revenue Impact:
15-25% improvement in forecast accuracy
10-20% increase in win rates
20-30% reduction in sales cycle length
25-35% improvement in quota attainment
Operational Benefits:
40% reduction in reporting time
60% faster identification of at-risk deals
30% improvement in coaching effectiveness
50% better resource allocation decisions
ROI Calculation Example
Annual Revenue: $10M
Team Size: 20 reps
Current Win Rate: 20%
With Improved KPIs:
Win Rate Improvement: 20% → 25% (+25% relative)
Revenue Impact: $10M × 25% = $2.5M additional revenue
Software Investment: $50K annually
ROI: 4,900%
Calculate your potential ROI →
Frequently Asked Questions About Sales KPIs
What are the 5 key performance indicators in sales?
The five most critical sales KPIs that every B2B team should track are:
Win Rate - Percentage of opportunities that close successfully
Sales Cycle Length - Time from first contact to deal closure
Pipeline Coverage - Pipeline value relative to quota requirements
Average Deal Size - Revenue per closed opportunity
Forecast Accuracy - How well predictions match actual results
What does KPI mean in sales?
KPI in sales stands for Key Performance Indicator - a quantifiable metric that measures the effectiveness of sales activities and outcomes. Sales KPIs provide objective data for evaluating individual and team performance, identifying improvement opportunities, and making strategic decisions.
What are good sales metrics to track?
The best sales metrics to track depend on your business goals, but generally include:
Activity Metrics: Calls, emails, meetings, proposals
Pipeline Metrics: Coverage, velocity, conversion rates
Outcome Metrics: Revenue, win rate, deal size
Efficiency Metrics: Cost per acquisition, sales cycle time
Quality Metrics: Customer satisfaction, retention rates
How often should sales KPIs be reviewed?
Daily: Activity metrics and pipeline health for individual reps
Weekly: Team performance and forecast updates for managers
Monthly: Comprehensive performance reviews and trend analysis
Quarterly: Strategic KPI assessment and target adjustments
What's the difference between sales metrics and KPIs?
Sales Metrics are any quantifiable measurements of sales activities or outcomes.
Sales KPIs are the specific, most important metrics that directly relate to business objectives and drive strategic decisions. All KPIs are metrics, but not all metrics are KPIs.
How many sales KPIs should we track?
Start with 5-7 core KPIs to avoid overwhelming your team. You can expand to 15-20 metrics as your processes mature and data quality improves. Focus on metrics that are actionable and directly impact revenue.
Conclusion: Transform Your Sales Performance with Strategic KPIs
Effective B2B sales KPI tracking is not just about collecting data—it's about creating a culture of accountability, continuous improvement, and data-driven decision making. The sales teams that consistently exceed their targets are those that understand their metrics, act on insights, and continuously optimize their approach.
Key Takeaways:
Focus on 5-7 core KPIs initially, expanding thoughtfully over time
Balance leading indicators (activities) with lagging indicators (outcomes)
Ensure data quality and consistent definitions across your organization
Use KPIs for coaching and process improvement, not just performance evaluation
Invest in tools that automate tracking and provide actionable insights
The competitive advantage goes to sales organizations that can measure what matters, identify trends early, and adapt quickly to changing conditions. By implementing the KPIs and best practices outlined in this guide, you'll build a sales operation that not only hits targets consistently but creates predictable, scalable growth.
Ready to revolutionize your sales KPI tracking?
Book a demo with Forecastio → and see how our AI-powered platform transforms your HubSpot data into actionable sales intelligence. Join hundreds of B2B teams who've improved their forecast accuracy by 35% and increased quota attainment by 28%.
Want to dive deeper into sales performance optimization? Explore our comprehensive guides on sales forecasting, pipeline management, and revenue operations.
Share:
Dmytro is a seasoned marketing professional with over 10 years in the B2B and startup ecosystem. He is passionate about helping companies better plan their revenue goals, improve forecast accuracy, and proactively address performance bottlenecks or seize growth opportunities.
Dmytro is a seasoned marketing professional with over 10 years in the B2B and startup ecosystem. He is passionate about helping companies better plan their revenue goals, improve forecast accuracy, and proactively address performance bottlenecks or seize growth opportunities.
Related articles

May 29, 2026
12 min

Pipeline Management
May 29, 2026
9 min

May 29, 2026
8 min
May 29, 2026
12 min
Pipeline Management
May 29, 2026
9 min
May 29, 2026
12 min
Pipeline Management
May 29, 2026
9 min
Sales Planning
Sales Forecasting
Sales Performance Insights
Sales Planning
Sales Forecasting
Sales Performance Insights
Sales Planning
Sales Forecasting
Sales Performance Insights


Product
© 2025 Forecastio, All rights reserved.
Sales Planning
Sales Forecasting
Sales Performance Insights
Sales Planning
Sales Forecasting
Sales Performance Insights
Sales Planning
Sales Forecasting
Sales Performance Insights
Product
© 2025 Forecastio, All rights reserved.
Sales Planning
Sales Forecasting
Sales Performance Insights
Sales Planning
Sales Forecasting
Sales Performance Insights
Sales Planning
Sales Forecasting
Sales Performance Insights
Product
© 2025 Forecastio, All rights reserved.