How to Assess and Improve Sales Pipeline Health

Alex Zlotko
CEO at Forecastio

What Is Sales Pipeline Health?
Sales pipeline health shows how likely your current sales pipeline is to turn into real revenue.
A healthy pipeline is not just a pipeline with many deals. It is a pipeline with enough qualified opportunities, clear deal status, realistic close dates, active buyer engagement, and steady movement through the sales process.
In simple terms, sales pipeline health helps sales leaders understand whether:
There are enough deals in the pipeline to reach revenue targets
Deals are moving through the sales pipeline stages at the right pace
Sales reps are focused on real opportunities, not weak or inactive deals
Pipeline data is accurate enough to support forecast accuracy
The sales team has a steady flow of qualified leads and potential customers
Stalled deals, risky deals, and poor-quality opportunities are visible early
A healthy sales pipeline gives a clear view of pipeline quality, pipeline value, and future revenue potential. It helps revenue operations teams and sales managers make data driven decisions.
Poor pipeline health creates the opposite problem. The sales team may have many deals in the CRM, but many of them can be inactive, poorly qualified, or unlikely to close. This makes pipeline reports look better than reality and leads to missed sales targets.
That is why sales pipeline health should be reviewed regularly. It helps companies understand not only how many deals they have, but how strong those deals really are.
Why Sales Pipeline Health Matters
Many companies focus on the size of their sales pipeline but overlook its quality. A large pipeline does not automatically translate into revenue. If opportunities are poorly qualified, inactive, or stuck in one stage for too long, the pipeline may create a false sense of confidence.
Maintaining strong sales pipeline health helps organizations identify risks earlier, improve decision-making, and create a more predictable revenue engine.
A healthy pipeline can have a positive impact on:
Sales forecast accuracy by providing a more realistic view of future revenue
Sales performance by helping sales reps focus on the right opportunities
Achievement of sales targets and revenue goals
Better resource allocation across territories, teams, and accounts
Faster b2b sales cycles and improved pipeline velocity
More effective sales efforts and follow-up activities
Earlier detection of stalled deals and pipeline bottlenecks
Improved visibility into deal quality and buyer engagement
Better planning for future months and future quarters
More consistent execution of the overall sales strategy
On the other hand, poor pipeline health can lead to inaccurate forecasts, missed revenue targets, wasted sales effort, and a growing gap between expected and actual results.
This is why many sales leaders and revenue operations teams conduct regular sales pipeline review meetings. The goal is not simply to track how many deals exist in the CRM, but to understand whether those opportunities are likely to convert into revenue.
How to Assess Sales Pipeline Health
Assessing sales pipeline health requires looking at several areas of your sales pipeline, not just one metric. A simple assessment process includes:
Review pipeline structure and distribution
Analyze deal progression
Evaluate deal quality
Identify pipeline risks and bottlenecks
Monitor pipeline trends over time
Let’s look at each step in more detail.
Review Pipeline Structure and Distribution
Start by reviewing how opportunities are distributed across your sales pipeline stages.
A healthy sales pipeline should contain a balanced mix of opportunities in early, middle, and late stages. Too many deals concentrated in one stage often indicate bottlenecks or qualification issues.
Look for:
A balanced distribution of opportunities
A steady flow of new deals
Sufficient pipeline coverage
No major gaps between stages
Analyze Deal Progression
Next, evaluate how efficiently deals move through your sales process.
Healthy pipelines show consistent progression from one stage to the next. Deals should not remain inactive for extended periods.
Pay attention to:
Sales cycle length
Pipeline velocity
Stage-to-stage movement
Conversion rates
Average deal age
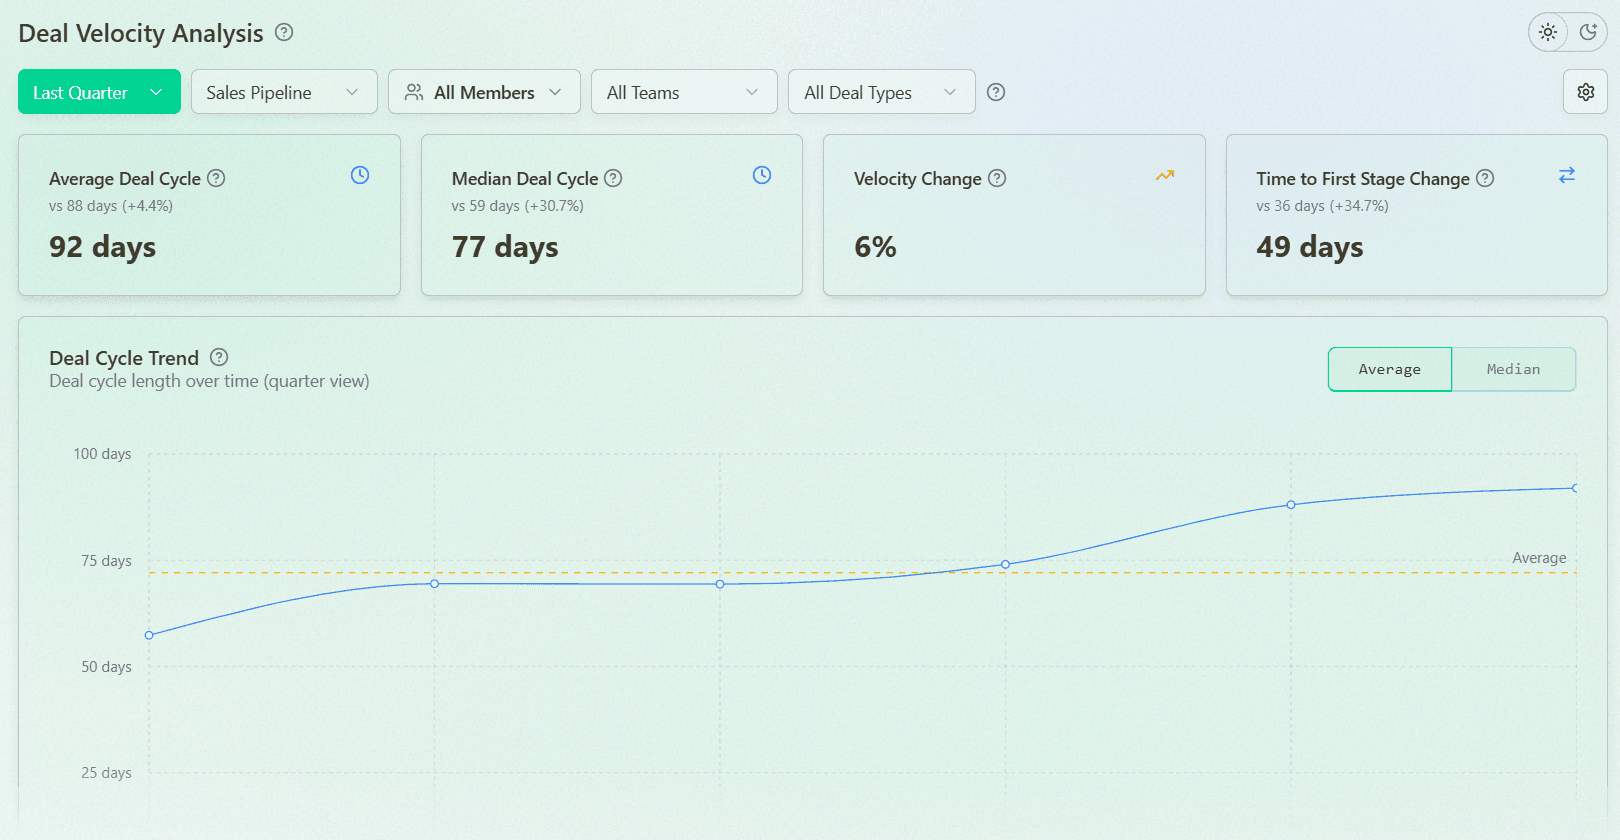
Deal Velocity Analysis with Forecastio
Evaluate Deal Quality
Not every opportunity contributes equally to pipeline health.
Review whether opportunities are properly qualified and actively engaged.
Key indicators include:
Identified decision makers
Access to the economic buyer
Clear next steps
Realistic close dates
Complete CRM records
Identify Pipeline Risks and Bottlenecks
Review the pipeline for issues that may impact future revenue.
Common warning signs include:
Stalled deals
Repeated close date changes
Missing activities
Low buyer engagement
Large numbers of aging opportunities
Monitor Pipeline Trends Over Time
Finally, track how pipeline performance changes over time.
One-time reviews provide limited insight. Regular reviews reveal whether pipeline quality is improving or deteriorating.
Monitor trends in:
Pipeline value
Pipeline coverage ratio
Win rate
Sales cycle length
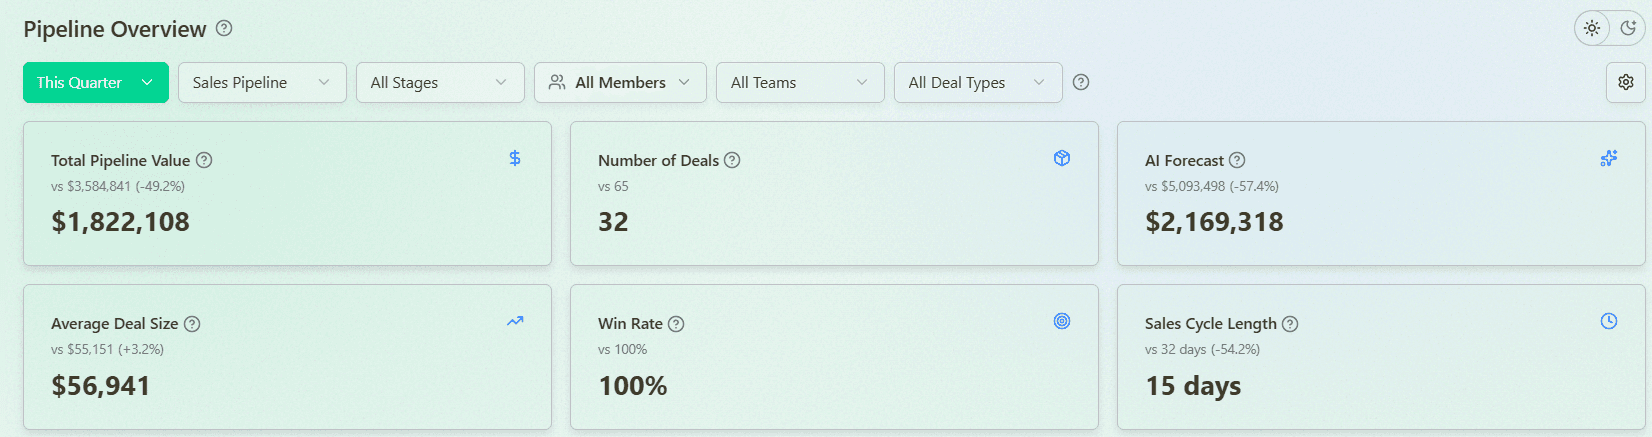
Pipeline Trends Analysis with Forecastio
Sales Pipeline Health Metrics
There is no single metric that can fully measure sales pipeline health. A complete assessment requires monitoring multiple pipeline metrics that evaluate pipeline size, quality, progression, and revenue potential.
Some pipeline metrics help determine whether there is enough pipeline to support future growth, while others help identify bottlenecks, risks, and inefficiencies in the sales process.
The table below summarizes the most important pipeline health metrics and the questions they help answer.
Metric | What it measures | Question it answers |
|---|---|---|
Pipeline Coverage Ratio | Pipeline size relative to target | Do we have enough pipeline to achieve our revenue targets? |
Weighted Pipeline Coverage | Probability-adjusted pipeline relative to target | Is our pipeline realistically capable of achieving our revenue targets? |
Average Deal Age | Average age of open opportunities | Are deals progressing as expected? |
Average Time in Stage | Time spent in each stage | Where are deals slowing down? |
Stalled Deal Rate | Percentage of inactive opportunities | How many deals are at risk? |
Pipeline Slippage Rate | Deals pushed into future periods | How reliable are our close dates and forecasts? |
Pipeline Leakage Rate | Revenue lost before closing | Where are we losing revenue? |
Pipeline Distribution by Stage | Distribution of deals and pipeline value across stages | Is the pipeline balanced across all stages? |
Next Step Coverage | Percentage of deals with a defined next action | Are opportunities actively managed by the sales team? |
Pipeline Hygiene Score | Completeness and quality of CRM data | Can we trust our pipeline data for forecasting and decision-making? |
Pipeline Coverage Ratio
What it measures
Pipeline coverage ratio is one of the most important sales pipeline metrics that measures whether the total pipeline value is sufficient to achieve your sales targets or revenue targets.
Formula
Pipeline Coverage Ratio = Total Pipeline Value ÷ Revenue Target
Example
Metric | Value |
|---|---|
Total Pipeline Value | $2,000,000 |
Quarterly Revenue Target | $500,000 |
Pipeline Coverage Ratio | 4.0x |
How to interpret it
A higher ratio generally indicates stronger revenue potential. However, a high ratio alone does not guarantee success if the pipeline contains low-quality opportunities or inactive deals.
Many B2B organizations target a pipeline coverage ratio between 3x and 5x, although the ideal benchmark depends on historical win rates and sales cycle length. HubSpot provides a detailed explanation of pipeline coverage and how it relates to forecasting and revenue predictability.
Weighted Pipeline Coverage
What it measures
While pipeline coverage measures the total pipeline against your target, weighted pipeline coverage accounts for the probability of each deal closing.
This provides a more realistic view of whether your pipeline can support future revenue.
Formula
Weighted Pipeline Coverage = Total Weighted Pipeline Value ÷ Revenue Target
Example
Deal | Value | Probability | Weighted Value |
|---|---|---|---|
Deal A | $100,000 | 80% | $80,000 |
Deal B | $150,000 | 50% | $75,000 |
Deal C | $200,000 | 20% | $40,000 |
Total | $450,000 | $195,000 |
If the revenue target is $100,000:
Weighted Pipeline Coverage = $195,000 ÷ $100,000 = 1.95x
How to interpret it
This metric helps determine whether the current pipeline is realistic or inflated by low-probability opportunities.
Pipeline Distribution by Stage
What it measures
This metric evaluates how pipeline value is distributed across different sales pipeline stages.
A healthy pipeline typically contains opportunities across all stages rather than being concentrated in one area.
Formula
There is no universal formula. Instead, calculate the percentage of deals or pipeline value in each stage.
Example
Stage | Pipeline Value | Percentage |
|---|---|---|
Discovery | $300,000 | 30% |
Qualification | $250,000 | 25% |
Proposal | $250,000 | 25% |
Negotiation | $200,000 | 20% |
How to interpret it
A large concentration of opportunities in one stage often indicates qualification issues, bottlenecks, or poor pipeline management.
Average Deal Age
What it measures
Average deal age measures how long opportunities remain open in the pipeline.
Formula
Average Deal Age = Total Age of Open Deals ÷ Number of Open Deals
Example
Metric | Value |
|---|---|
Total Age of Open Deals | 1,800 Days |
Open Deals | 60 |
Average Deal Age | 30 Days |
How to interpret it
A rising average deal age often signals process bottlenecks or poor qualification.
Average Time in Stage
What it measures
This metric measures how long opportunities spend in each pipeline stage.
Formula
Average Time in Stage = Total Days Spent in Stage ÷ Number of Deals in Stage
Example
Metric | Value |
|---|---|
Total Days in Proposal Stage | 600 |
Deals in Proposal Stage | 20 |
Average Time in Stage | 30 Days |
How to interpret it
Long durations in one stage often indicate process inefficiencies.
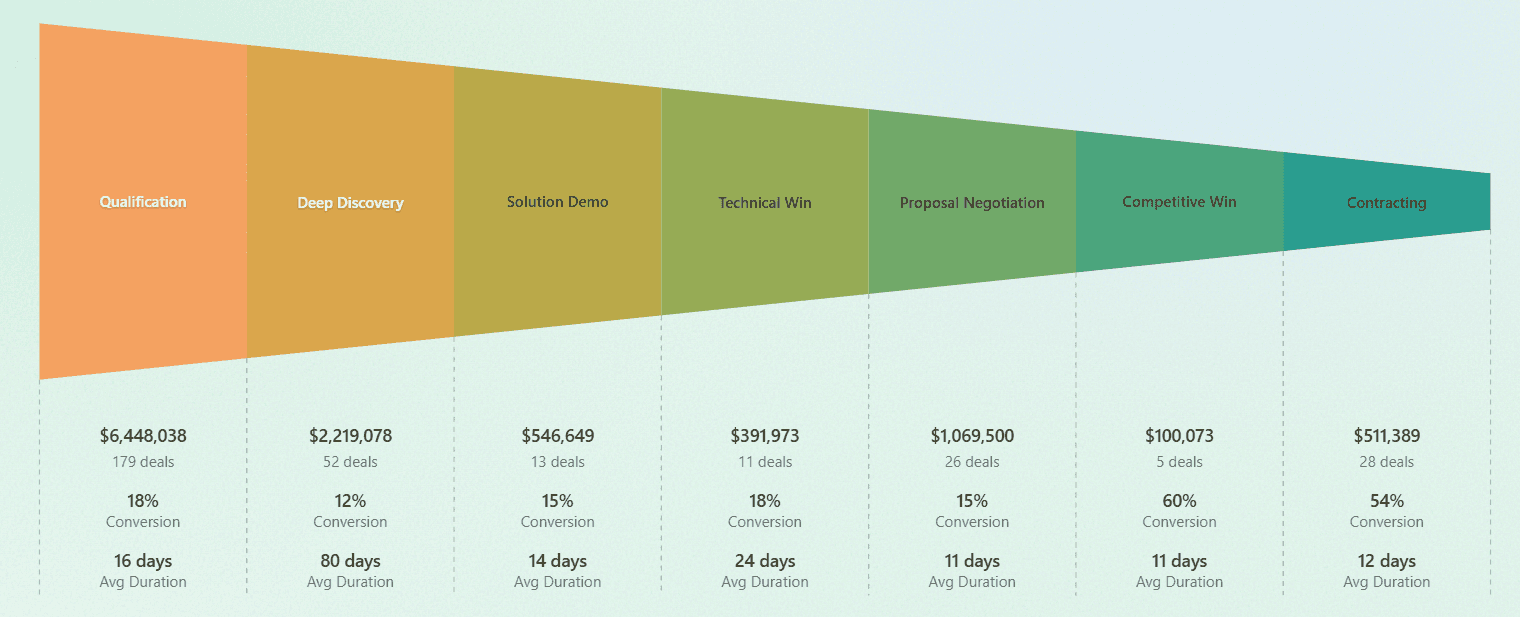
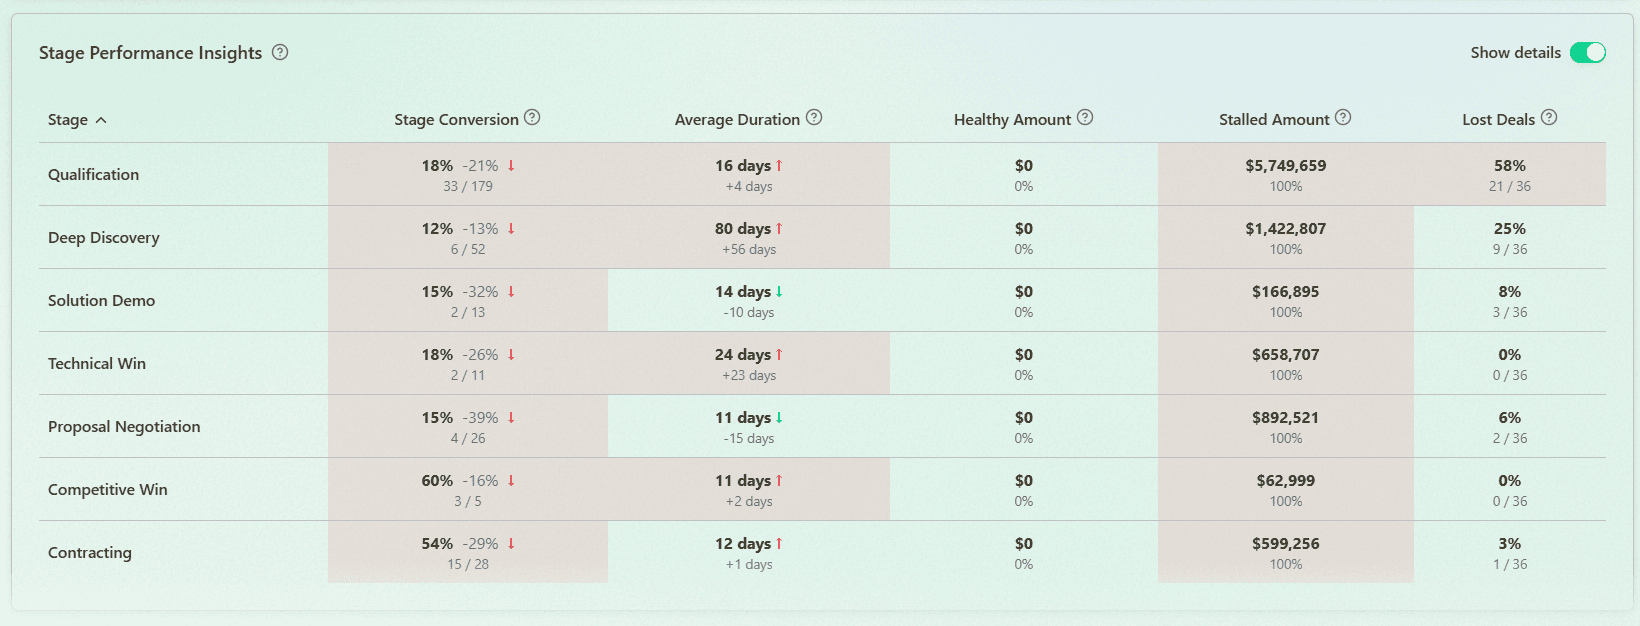
Advanced Pipeline Stage Analysis with Forecastio
Stalled Deal Rate
What it measures
Stalled deal rate measures the percentage of opportunities that have not shown meaningful progress within a defined period.
Formula
Stalled Deal Rate = Stalled Deals ÷ Total Open Deals × 100
Example
Metric | Value |
|---|---|
Stalled Deals | 15 |
Total Open Deals | 100 |
Stalled Deal Rate | 15% |
How to interpret it
A high percentage of stalled deals can significantly reduce overall pipeline quality. It’s important to measure this metric as stalled deals always lead to a longer average sales cycle length. Less than 10-15% of deals should be inactive for 30 days.
Stalled opportunities are one of the most common indicators of poor pipeline health. In his article The Anatomy of a Stalled Deal (And How to Bring It Back to Life), Tony Shepherd highlights common causes of stalled deals, including weak discovery, lack of stakeholder alignment, poor access to economic buyers, and unclear business value. These issues often lead to opportunities remaining in the pipeline without meaningful progress.
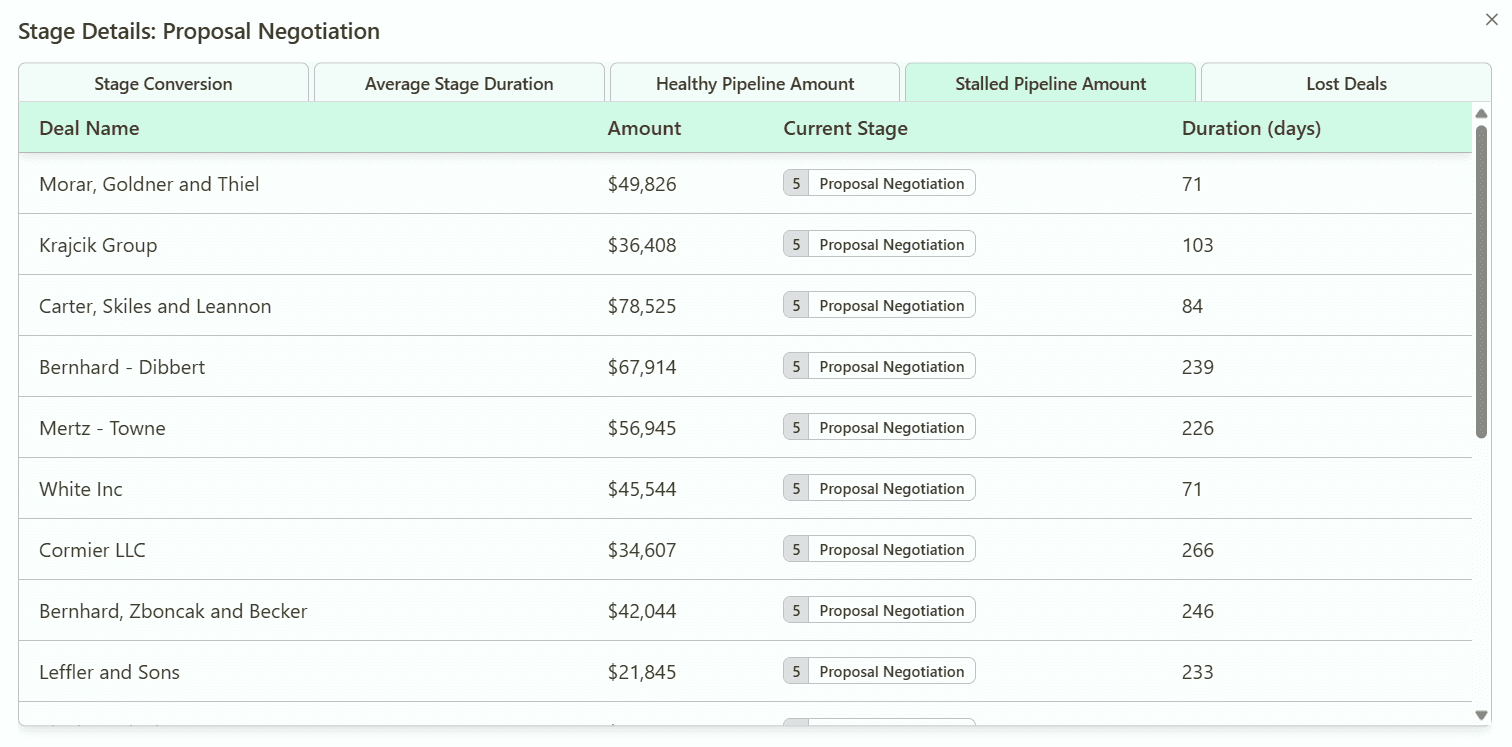
Stalled Deals Analysis in Forecastio
Pipeline Slippage Rate
What it measures
Pipeline slippage rate measures how often opportunities are pushed into future periods.
Formula
Pipeline Slippage Rate = Slipped Deals ÷ Forecasted Deals × 100
Example
Metric | Value |
|---|---|
Slipped Deals | 18 |
Forecasted Deals | 60 |
Slippage Rate | 30% |
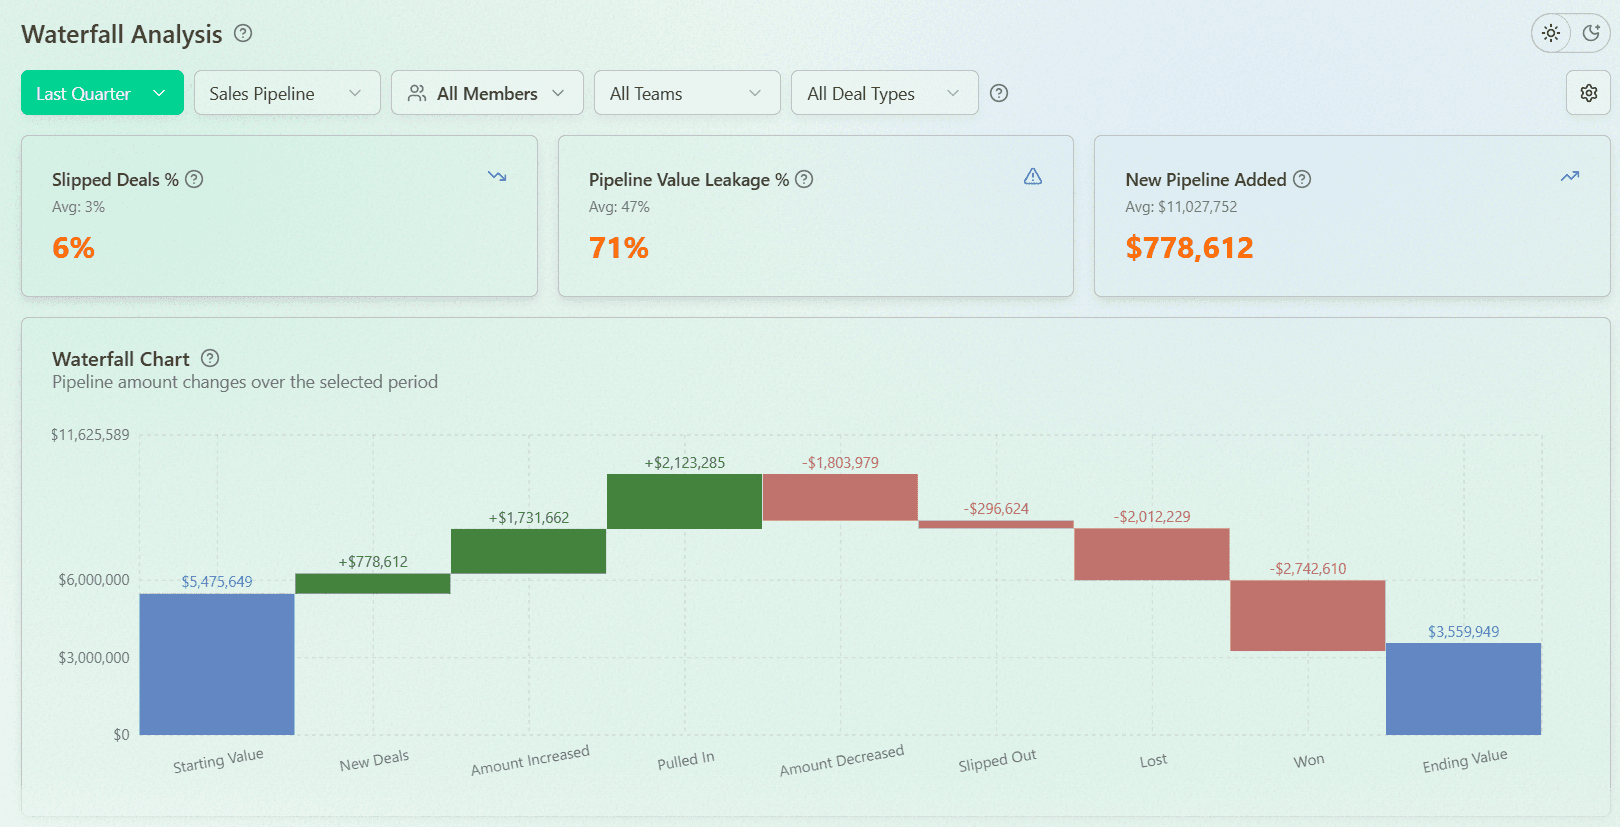
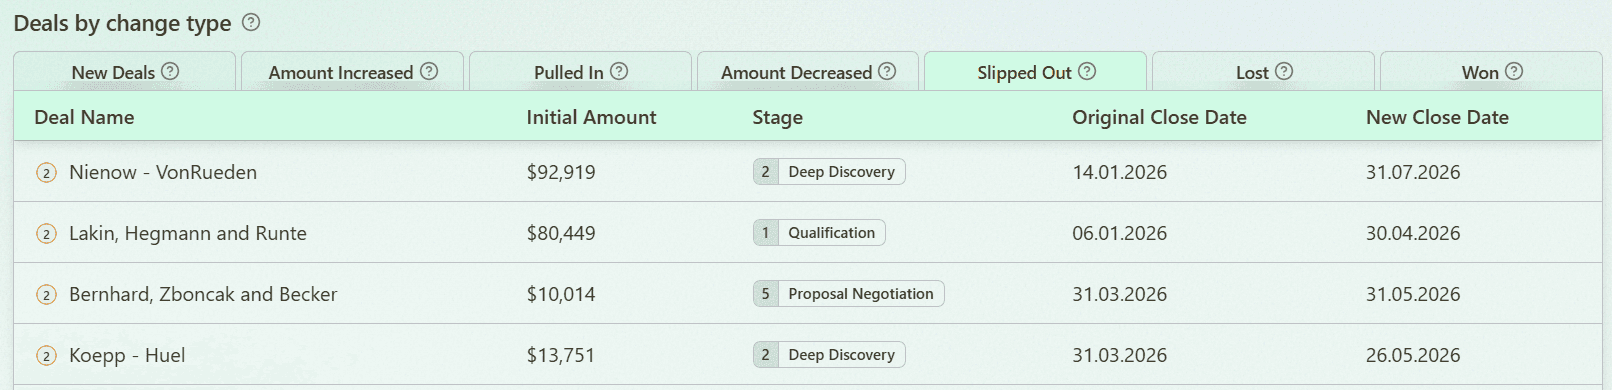
Deal Slippage Tracking with Forecastio
How to interpret it
High slippage rates often indicate issues with proper estimation of close dates.
Pipeline Leakage Rate
What it measures
Pipeline leakage rate measures how much pipeline is lost before opportunities reach a successful outcome.
Formula
Pipeline Leakage Rate = (Slipped Amounts + Lost Amounts + Decreased Amounts) ÷ Total Starting Pipeline Value × 100
Example
Metric | Value |
|---|---|
Slipped Amounts | $100,000 |
Lost Amounts (lost deals) | $200,000 |
Decreased Amounts | $50,000 |
Starting Pipeline Value | $1,000,000 |
Revenue Leakage Rate | 35% |
How to interpret it
Higher leakage rates suggest problems with qualification, buyer engagement, or pipeline management.
Stage Conversion Rate
What it measures
Stage conversion rate measures the percentage of opportunities that successfully move from one stage to the next.
Formula
Stage Conversion Rate = Deals Moved to Next Stage ÷ Deals Entering Current Stage × 100
Example
Metric | Value |
|---|---|
Deal Entering Qualification | 100 |
Deals Moving to Demo | 70 |
Stage Conversion Rate | 70% |
How to interpret it
Low conversion rates between stages help identify bottlenecks and weaknesses in the sales funnel. Tracking stage conversion is one of the most effective ways to evaluate overall pipeline performance.
Next Step Coverage
What it measures
Next step coverage measures the percentage of opportunities with a clearly defined next action.
It helps determine whether deals are actively managed and progressing through the pipeline.
Formula
Next Step Coverage = Deals with Next Step ÷ Total Open Deals × 100
Example
Metric | Value |
|---|---|
Open Deals | 100 |
Deals With Next Step | 85 |
Next Step Coverage | 85% |
How to interpret it
Low coverage often indicates weak follow-up processes and increases the likelihood of stalled deals.
Pipeline Hygiene Score
What it measures
Pipeline hygiene score evaluates the quality and completeness of your pipeline data. It helps determine whether the information stored in your CRM is accurate enough for forecasting, reporting, and pipeline analysis.
Formula
Pipeline Hygiene Score = Average Deal Hygiene Score Across All Open Deals
Each deal receives a score based on predefined criteria.
Example
A company may evaluate every opportunity using the following scoring model:
Criteria | Weight | Max Score | Scoring Rule |
|---|---|---|---|
Close Date Updated | 20% | 100 | 100 if updated within 30 days, otherwise 0 |
Next Step Present | 20% | 100 | 100 if next step exists, otherwise 0 |
Recent Activity Logged | 20% | 100 | 100 if activity within 14 days, otherwise 0 |
Required Fields Completed | 20% | 100 | % Completed × Max Score |
Decision Maker Identified | 20% | 100 | 100 if identified, otherwise 0 |
Deal Hygiene Score
(100 × 20%) + (100 × 20%) + (100 × 20%) + (100 × 50% × 20%) + (100 × 20%) = 90
Let's assume your pipeline contains five open deals:
Deal | Hygiene Score |
|---|---|
Deal A | 90 |
Deal B | 95 |
Deal C | 80 |
Deal D | 70 |
Deal E | 80 |
Pipeline Hygiene Score
(90 + 95 + 80 + 70 + 80) ÷ 5 = 83
How to interpret it
Score | Interpretation |
|---|---|
90-100 | Excellent pipeline hygiene |
80-89 | Good pipeline hygiene |
70-79 | Moderate pipeline hygiene |
Below 70 | Poor pipeline hygiene |
Key Benchmarks for a Healthy Pipeline
Metric | Benchmark |
|---|---|
Pipeline Coverage Ratio | 3x–5x of your revenue target |
Win Rate | Above 50% indicates strong pipeline health |
Active Deal Engagement | More than 70% of opportunities show activity within the last 14 days |
Next Step Coverage | More than 80% of opportunities have a defined next step |
Pipeline Slippage Rate | Below 20–25% |
Stalled Deal Rate | Below 10–15% |
Pipeline Hygiene Score | 80 |
Pipeline Distribution | No single stage contains more than 30% of all deals in the pipeline |
Average Time in Stage | Close to historical averages for each stage |
Not every benchmark applies to every business, but if your pipeline meets most of these criteria, it is generally considered healthy.
Key Factors Impacting Sales Pipeline Health
Several factors can negatively impact sales pipeline health and reduce the likelihood of achieving future revenue targets.
Poor Deal Qualification
Poorly qualified opportunities inflate pipeline value without significantly increasing the likelihood of future revenue. These deals often remain open for extended periods or eventually become lost opportunities.
The impact of qualification can be substantial. According to a 2024 benchmark study by Ebsta and Pavilion, win rates were 3.1 times higher when opportunities matched the seller's Ideal Customer Profile (ICP). However, only 18% of pipeline opportunities analyzed in the study matched ICP criteria.
Insufficient Pipeline Generation
A healthy pipeline requires a steady flow of new opportunities. When too few deals enter the pipeline, future stages become underpopulated, creating revenue gaps in future months and quarters.
Long Sales Cycles
An unusually long sales cycle increases average deal age, delays revenue realization, and reduces forecast reliability.
Ineffective Sales Process
An unclear or inconsistent sales process makes it difficult for opportunities to progress through the pipeline efficiently. This often results in longer sales cycles, lower conversion rates, and increased pipeline risk.
Weak Follow-Up Practices
Deals require regular engagement to maintain momentum. Infrequent follow-ups often lead to inactive opportunities, buyer disengagement, and higher rates of stalled deals.
Lack of Access to Decision Makers
Opportunities are less likely to progress when sales teams engage primarily with end users rather than key stakeholders and purchasing authorities.
Lack of Multithreading
In complex B2B sales, relying on a single contact creates significant risk. If that contact leaves the company or loses influence, the opportunity can stall or disappear entirely.
Poor CRM Hygiene
Incomplete or outdated pipeline data reduces visibility into the true condition of the pipeline and makes forecasting less reliable.
Poor Close Date Assessment
Many sales teams assign close dates based on optimism rather than actual buyer progress. As a result, opportunities are repeatedly pushed into future periods, reducing forecast accuracy and increasing pipeline slippage.
How to Improve Sales Pipeline Health
Improving sales pipeline health requires consistent attention to pipeline quality, deal progression, and buyer engagement. The goal is not to increase the number of opportunities, but to build a healthy pipeline that supports long-term growth and predictable revenue.
Improve Deal Qualification
Regularly review qualification criteria and remove opportunities that no longer fit your ideal customer profile or show little buying intent. A smaller qualified pipeline is often more valuable than a larger pipeline filled with low-quality opportunities.
Maintain a Steady Flow of New Opportunities
Healthy pipelines require a steady flow of new opportunities entering the funnel. Monitor lead generation activities and ensure enough qualified leads are being created to support future growth.
Simplify Your Sales Process
Review your sales process regularly and eliminate unnecessary steps that slow down deal progression. The easier it is for buyers to move through the process, the easier it becomes to maintain momentum.
Improve Follow-Up Consistency
Many opportunities are lost simply because follow-ups stop too early. Establish clear follow-up standards and ensure every opportunity has a defined next step.
Engage Multiple Stakeholders
In complex B2B sales, relying on a single contact increases risk. Build relationships with multiple stakeholders, including decision makers and the economic buyer, to improve deal stability and reduce dependency on one individual.
Keep CRM Data Up to Date
Accurate data is essential for effective sales pipeline management. Regularly review deal records, update close dates, and ensure key fields are completed. Reliable data helps teams make better data driven decisions and improves the quality of pipeline reviews.
Review Close Dates Using Historical Data
Instead of relying on intuition, use historical data to validate close dates and expected deal progression. This helps reduce forecasting errors and provides a more realistic view of future revenue.
Conduct Regular Pipeline Reviews
Perform regular pipeline reviews to identify risks, assess deal quality, and evaluate whether opportunities are progressing as expected. Reviewing the pipeline weekly helps teams identify issues before they impact future results.
Use Pipeline Intelligence Software
Modern pipeline management tools provide a visual representation of pipeline activity, helping teams understand how deals in your pipeline are progressing and where attention is needed.
These platforms automate pipeline analysis, uncover hidden risks, help managers track progress, and support better resource allocation across teams and territories. They also help organizations prepare for future quarters by identifying trends that may not be visible during manual reviews.
How Forecastio Helps Maintain Healthy Pipeline
Tracking sales pipeline health manually can be time-consuming, especially for teams managing hundreds of opportunities across multiple pipelines.
Forecastio helps sales leaders and revenue operations teams monitor pipeline health automatically and identify risks before they impact revenue.
With Forecastio, teams can:
Monitor pipeline coverage and weighted pipeline coverage
Identify stalled deals and aging opportunities
Track average deal age and average time in stage
Measure pipeline slippage and pipeline leakage
Analyze pipeline distribution across stages
Detect opportunities with unrealistic close dates
Review pipeline trends using historical snapshots
Monitor pipeline health at the rep, team, and company levels
Forecastio's Pipeline Intelligence dashboards provide a clear visual representation of pipeline activity, helping managers quickly understand where opportunities are slowing down and where corrective action is needed.
In addition, Forecastio's AI-powered insights and AI Agents for Revenue Operations help teams identify risks, prioritize pipeline reviews, and focus attention on the opportunities that matter most. For example, a Deal Review Agent can automatically analyze open opportunities, identify stalled or aging deals, detect unrealistic close dates, and recommend or even perform next actions.
FAQ
How Do You Qualify a Healthy Sales Pipeline?
A qualified pipeline contains enough sales opportunities to support future revenue goals. Opportunities should have a clear business need, active buyer engagement, realistic close dates, and access to key stakeholders. Effective qualification also helps sales teams focus their sales efforts on opportunities with the highest likelihood of success instead of spending time on low-quality deals.
What Is a Healthy Sales Pipeline Conversion Rate?
There is no universal benchmark for pipeline conversion rates because they vary by industry, average deal size, and sales model. Conversion rates typically range from 30% to 60% between stages. The most important factor is consistency. Significant changes in conversion rates often indicate issues with qualification, buyer engagement, or the overall sales strategy.
What Is a Good Pipeline Coverage Ratio?
A good pipeline coverage ratio depends on historical performance, win rate, deal values, and the predictability of your sales process. Many B2B organizations target a ratio between 3x and 5x their revenue target.
For example, if your quarterly target is $500,000, you may need between $1.5M and $2.5M in total pipeline value. However, coverage should always be evaluated alongside pipeline quality and historical data from previous periods.
What Is a Good Pipeline Slippage Rate?
A good pipeline slippage rate depends on the complexity of your sales motion and the length of the buying cycle. In general, lower is better.
If a large percentage of deals is repeatedly pushed into future periods, it may indicate poor close date assessment, weak qualification, or process issues. Many companies aim to keep their slippage rate below 20–25%, although acceptable benchmarks vary by industry.
How Often Should You Review Your Pipeline?
Most organizations conduct regular pipeline reviews on a weekly basis. Reviewing the pipeline weekly helps teams track progress, identify risks earlier, and improve planning for future quarters.
Weekly reviews also help sales managers understand how opportunities are progressing, whether potential customers remain engaged, and whether additional actions are needed to move deals forward.
What Is a Good Win Rate for a Healthy Pipeline?
A good win rate depends on your industry, deal size, and sales model. However, the following benchmarks can serve as a guideline:
Below 20% — May indicate qualification or pipeline quality issues
20–35% — Typical for many B2B sales organizations
35–50% — Strong performance
Above 50% — Win rates above 50% indicate strong pipeline health
Win rate should be evaluated alongside other metrics such as pipeline coverage ratio and average deal size to get a complete picture of pipeline quality.
What KPIs Define a Healthy Sales Pipeline?
The most important KPIs for evaluating pipeline health include:
Pipeline Coverage Ratio — Measures whether the pipeline is large enough to achieve revenue targets
Weighted Pipeline Coverage — Evaluates the realistic revenue potential of the pipeline
Average Deal Age — Identifies aging opportunities
Stalled Deal Rate — Measures the percentage of inactive deals
Pipeline Slippage Rate — Tracks how often deals are pushed into future periods
Pipeline Leakage Rate — Measures lost pipeline value
Win Rate — Evaluates the effectiveness of qualification and sales execution
Together, these KPIs help sales leaders assess pipeline quality, identify risks early, and make more informed decisions about future revenue.
Share: