
10 HubSpot Sales Dashboard Examples to Boost Your Sales Performance
Nov 30, 2025
Nov 30, 2025

Dmytro Chervonyi
CMO at Forecastio
Last updated
Nov 30, 2025
Reading time
8 min
Share:
Share


In today’s data-obsessed sales world, visualizing complex sales data is key to tracking progress, optimizing processes, and making informed decisions. HubSpot’s sales dashboards give you a centralized platform to monitor key performance indicators (KPIs), measure team performance, and drive revenue growth. With the ability to create custom reporting dashboards for your business needs, you can tie CRM data to sales and marketing data together. This post looks at 10 HubSpot dashboard examples and provides tips to help you supercharge your sales.
If you’re a sales leader looking to get the most out of HubSpot then this post is for you.
What is a HubSpot Sales Dashboard?
A HubSpot sales dashboard, part of HubSpot’s comprehensive sales reporting tools, is a customizable visualization of key sales metrics and performance data. It helps teams monitor activity, measure progress, and stay aligned with revenue targets. By connecting data from sales, marketing, and customer service, these dashboards give teams a complete 360° view of their pipeline and sales performance.
When implemented effectively, a HubSpot sales dashboard becomes more than just a reporting tool — it’s a strategic command center. By following sales dashboard best practices, businesses can design dashboards that deliver meaningful insights at a glance. For example, clear HubSpot dashboard examples often include metrics like deal velocity, conversion rates, and forecast accuracy, helping sales leaders identify where to focus their team’s effort.
Looking through different HubSpot sales dashboard examples or sales dashboard samples can also inspire better layout and data visualization choices. A well-structured dashboard allows teams to act on trends quickly, improving forecasting accuracy and decision-making.
Tools like Forecastio take this a step further by integrating directly with HubSpot to transform dashboard insights into predictive, AI-driven forecasts. With up to 95% forecast accuracy, Forecastio enables sales leaders to move from static sales dashboard examples to dynamic, real-time forecasting that powers confident, data-backed revenue planning.
Why use HubSpot sales dashboards?
Centralized Data: Tie all your sales, marketing, and customer service data together in one place for a complete view of performance.
Custom Reporting: Create reports for your business needs to visualize and analyze data.
Real-Time Insights: Monitor metrics in real time to adjust fast.
Actionable Insights: Identify areas of improvement and coach your reps effectively.
→ Dashboards work best when you clearly understand your pipeline stages. Read more about HubSpot sales pipeline stages.
HubSpot sales dashboard benefits
HubSpot sales dashboards are a must-have for sales teams in today’s sales operations. Here are the benefits:
More Visibility: HubSpot sales dashboards give you a full view of the sales process so your sales team can track progress and performance easily. By visualizing key metrics sales leaders can see trends and areas to focus on.
Better Decision Making: With real-time data and insights at their fingertips sales teams can make decisions fast. HubSpot’s sales reporting tools ensure the data is always up to date so you can adjust fast.
More Productivity and Efficiency: Streamlined reporting and analytics save time and reduce manual effort to get the data. Sales teams can focus more on selling and less on admin tasks, and overall productivity will increase.
More Aligned to Sales Goals: Customizable dashboards and reports allow sales teams to align their activity to overall sales goals and objectives. By customizing the dashboards to your business needs teams can stay focused on what matters most.
Better Collaboration and Communication: Shared dashboards and reports mean better communication and collaboration between sales teams. Everyone is on the same page so efforts are coordinated and team members are working towards the same goals.
By using HubSpot sales dashboards sales teams can perform better, simplify their processes, and get better results.

Essential components of a sales dashboard
A good sales dashboard is key to giving you a clear and complete view of sales performance. Here are the essentials:
Sales performance metrics
Sales performance metrics are vital for understanding how well the sales team is performing and progressing towards their goals. Key metrics to include are:
Sales Revenue and Growth Rate: Track the total revenue generated and the growth rate over time to assess overall performance.
Conversion Rates and Sales Velocity: Measure the percentage of leads that convert to customers and the speed of deals moving through the sales pipeline.
Sales Pipeline and Funnel Analysis: Analyze the stages of the sales pipeline to see where the bottlenecks and opportunities to improve.
Sales Team Performance and Ranking: Measure individual and team performance to see who’s performing and who needs support.
Discover how your business is growing with our Growth Rate Calculator — analyze trends and optimize strategies with Forecastio.
Sales activity tracking
Sales activity tracking gives you insight into what the sales team is doing daily. Monitor:
Number of Calls, Emails, and Meetings: Monitor the volume of outreach to ensure prospect engagement.
Time Spent on Sales Activities: See how much time reps are spending on different activities to see where to improve efficiency.
Sales Activity Completion Rates and Productivity: Measure the completion rates of scheduled activities and overall productivity to see if the team is on track.
Sales forecasting and pipeline management
Forecasting and pipeline management are key to predicting future performance and a healthy pipeline. Key metrics to include are:
Sales Pipeline and Funnel Analysis: Monitor the pipeline health to ensure a constant flow of opportunities.
Deal Stage and Probability Analysis: See the probability of deals closing at each stage of the pipeline to focus efforts.
Sales Forecasting and Revenue Projections: Use historical data and the current pipeline to forecast future sales and set realistic goals.
Pipeline Management and Optimization: Review and optimize the pipeline regularly to remove bottlenecks and improve deal velocity.
Evaluate the vitality of your sales funnel — try our Pipeline Health Score Calculator to gain actionable insights and drive better sales outcomes.
By including these essentials a sales dashboard will give you a complete view of the sales team’s performance and progress so you can make data-driven decisions and get better sales results.
How Forecastio Enhances HubSpot Forecasting Dashboards
HubSpot gives you a solid starting point for tracking pipeline and forecast numbers, but Forecastio adds the level of depth sales leaders actually need. It introduces forecasting dashboards that show accuracy trends over time, highlight where forecasts were over- or under-estimated, and reveal patterns across teams or segments. You also get a clear audit trail, so you can instantly see who changed the forecast, when it happened, and how it affected the final number. Together, these insights make your HubSpot forecasting process more transparent, more predictable, and much easier to trust.
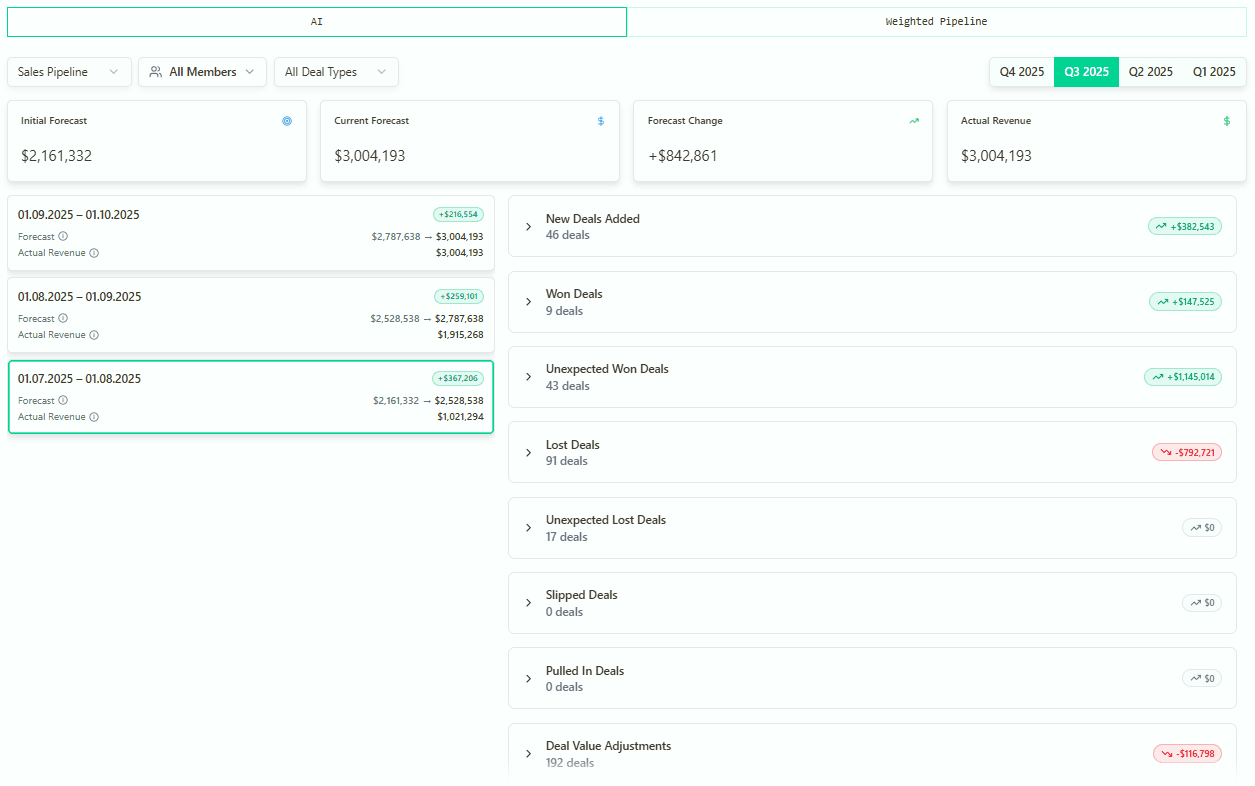
Comprehesive Forecast Audit Trail with Forecastio
Types of HubSpot sales dashboards
1. Sales performance dashboard
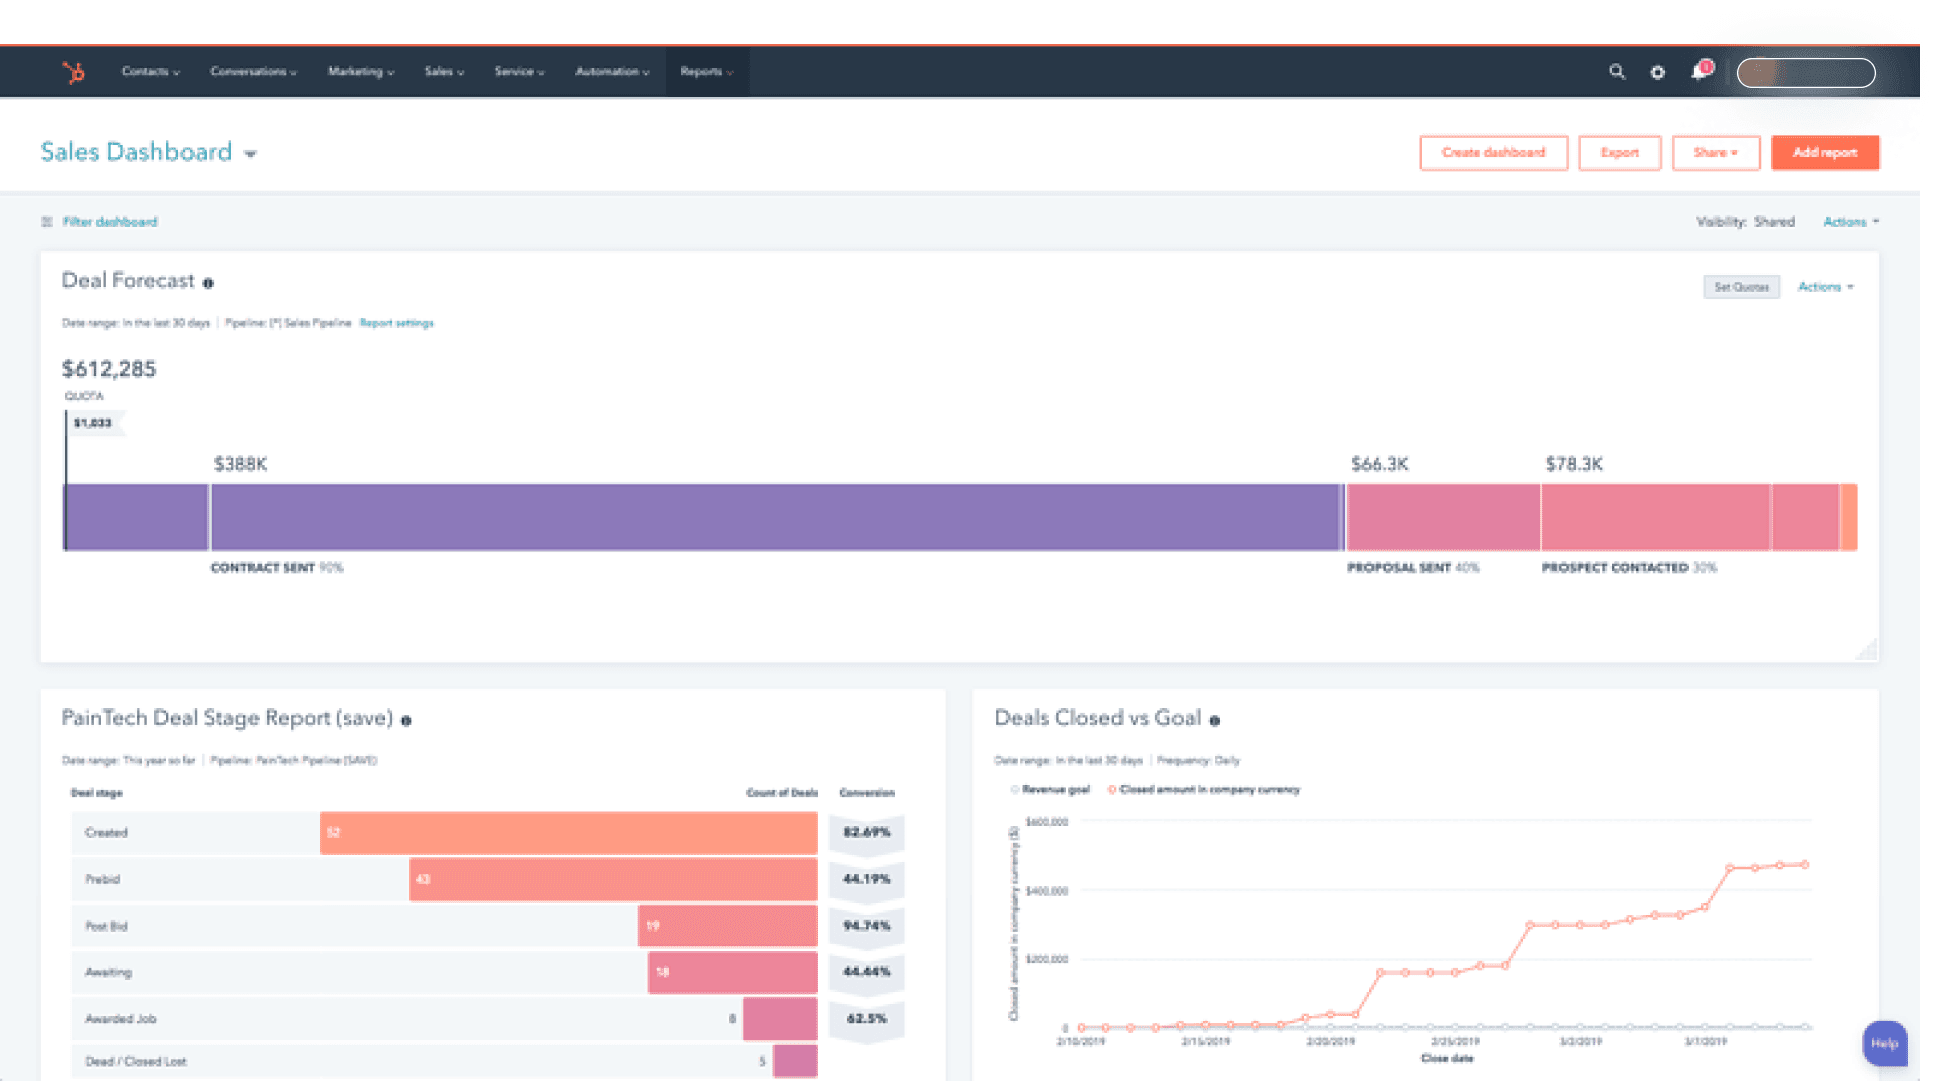
Track overall sales performance with metrics like total revenue, closed deals, deal value, and conversion rates. This dashboard helps sales leaders see key sales metrics so they can see how the team is performing and growing. By looking at performance holistically you can see what’s working and what needs to improve.
Key Features:
Revenue Tracking: Monitor monthly or quarterly revenue to hit targets.
Pipeline Visibility: See the number of deals at each stage of the pipeline.
Sales Rep Performance: Measure individual sales rep performance on deals closed and meetings booked. This includes metrics like monthly progress and average deal size to see how they’re performing and to create competition between team members.
Benefits:
Holistic View: Get a top-level view of your sales team’s performance.
Identify Gaps: See where deals are stuck in the pipeline.
Drive your revenue growth with our in-depth guide to sales performance analysis, featuring actionable metrics and insights to fine-tune your team’s effectiveness.
2. Sales activities dashboard
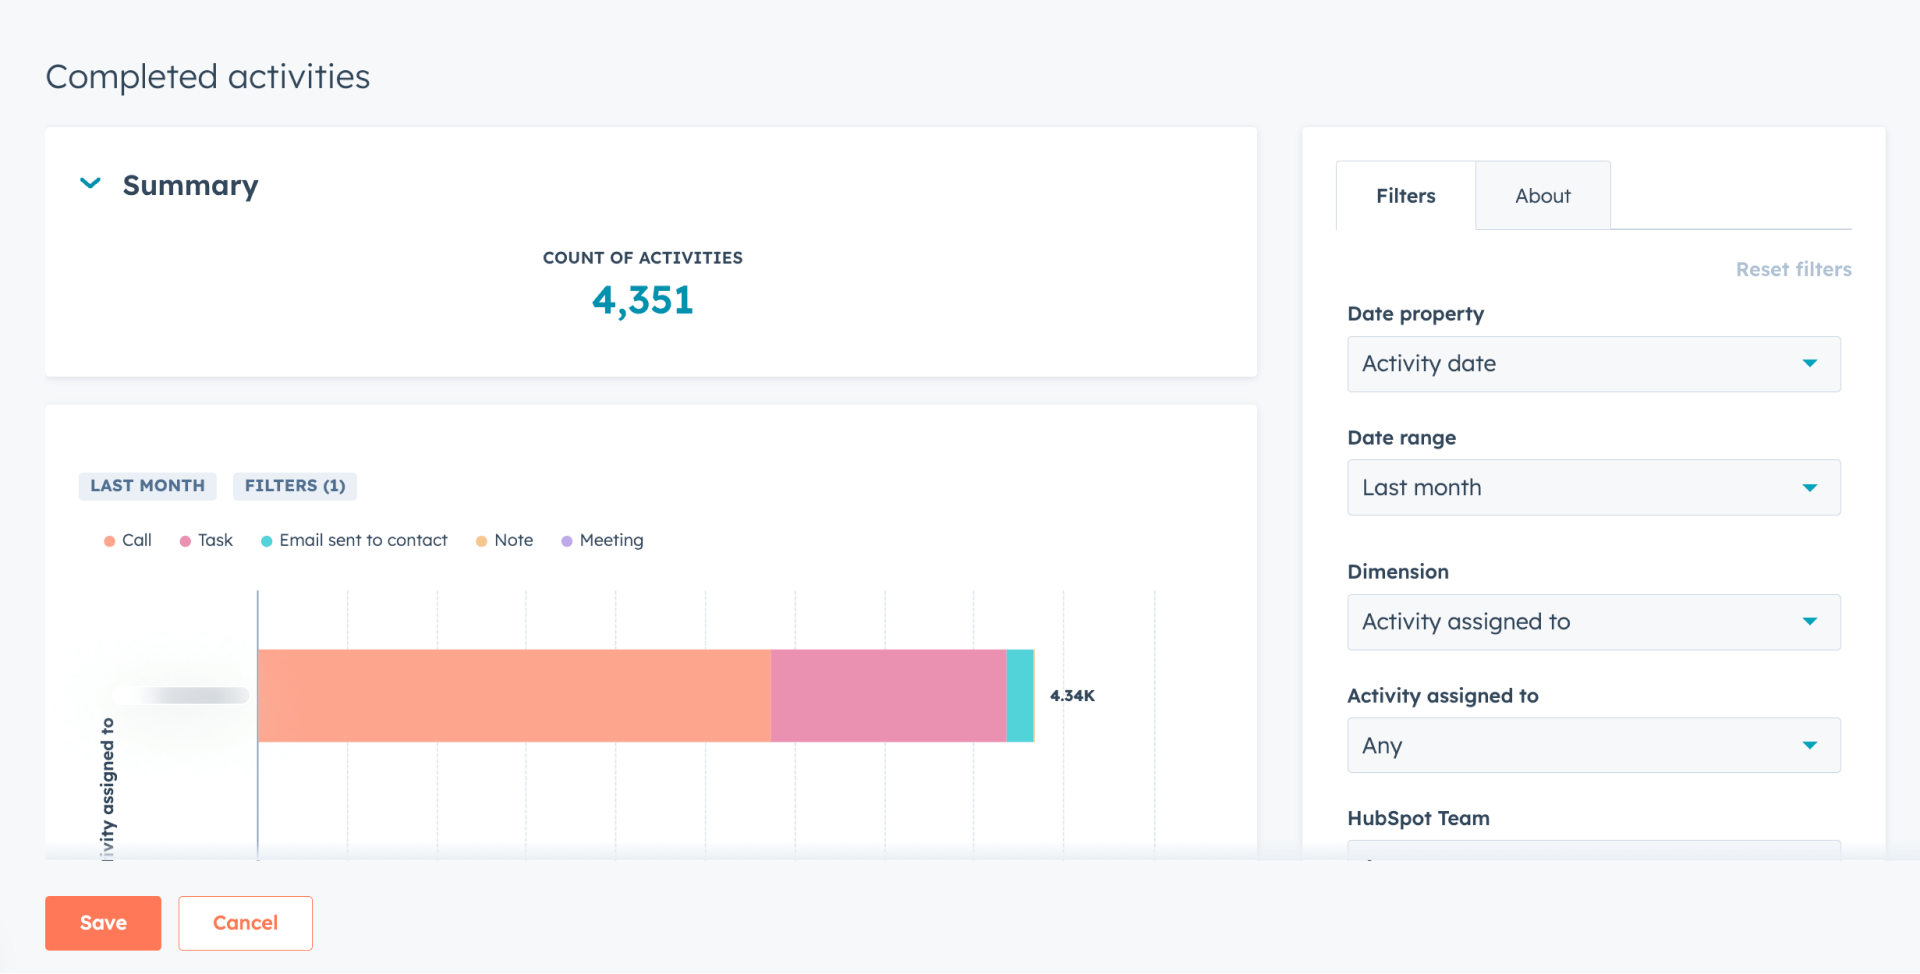
Focus on sales team activity including calls, emails, meetings, and tasks to ensure prospect engagement. This dashboard gives you a detailed view of each rep’s productivity so you can hold the team accountable and make data-driven changes to your outreach strategy. With real-time activity tracking and sales analytics you can see what’s working.
Key Features:
Activity Tracking: See all completed activities including calls, emails, and meetings.
Custom Date Range: Filter activities by specific periods.
Engagement Metrics: Use sales analytics to see how reps are engaging with prospects and customers.
Benefits:
Accountability: Hold reps accountable by tracking daily activity.
Engagement Analysis: See which activities are driving higher conversion rates.
3. Sales pipeline dashboard
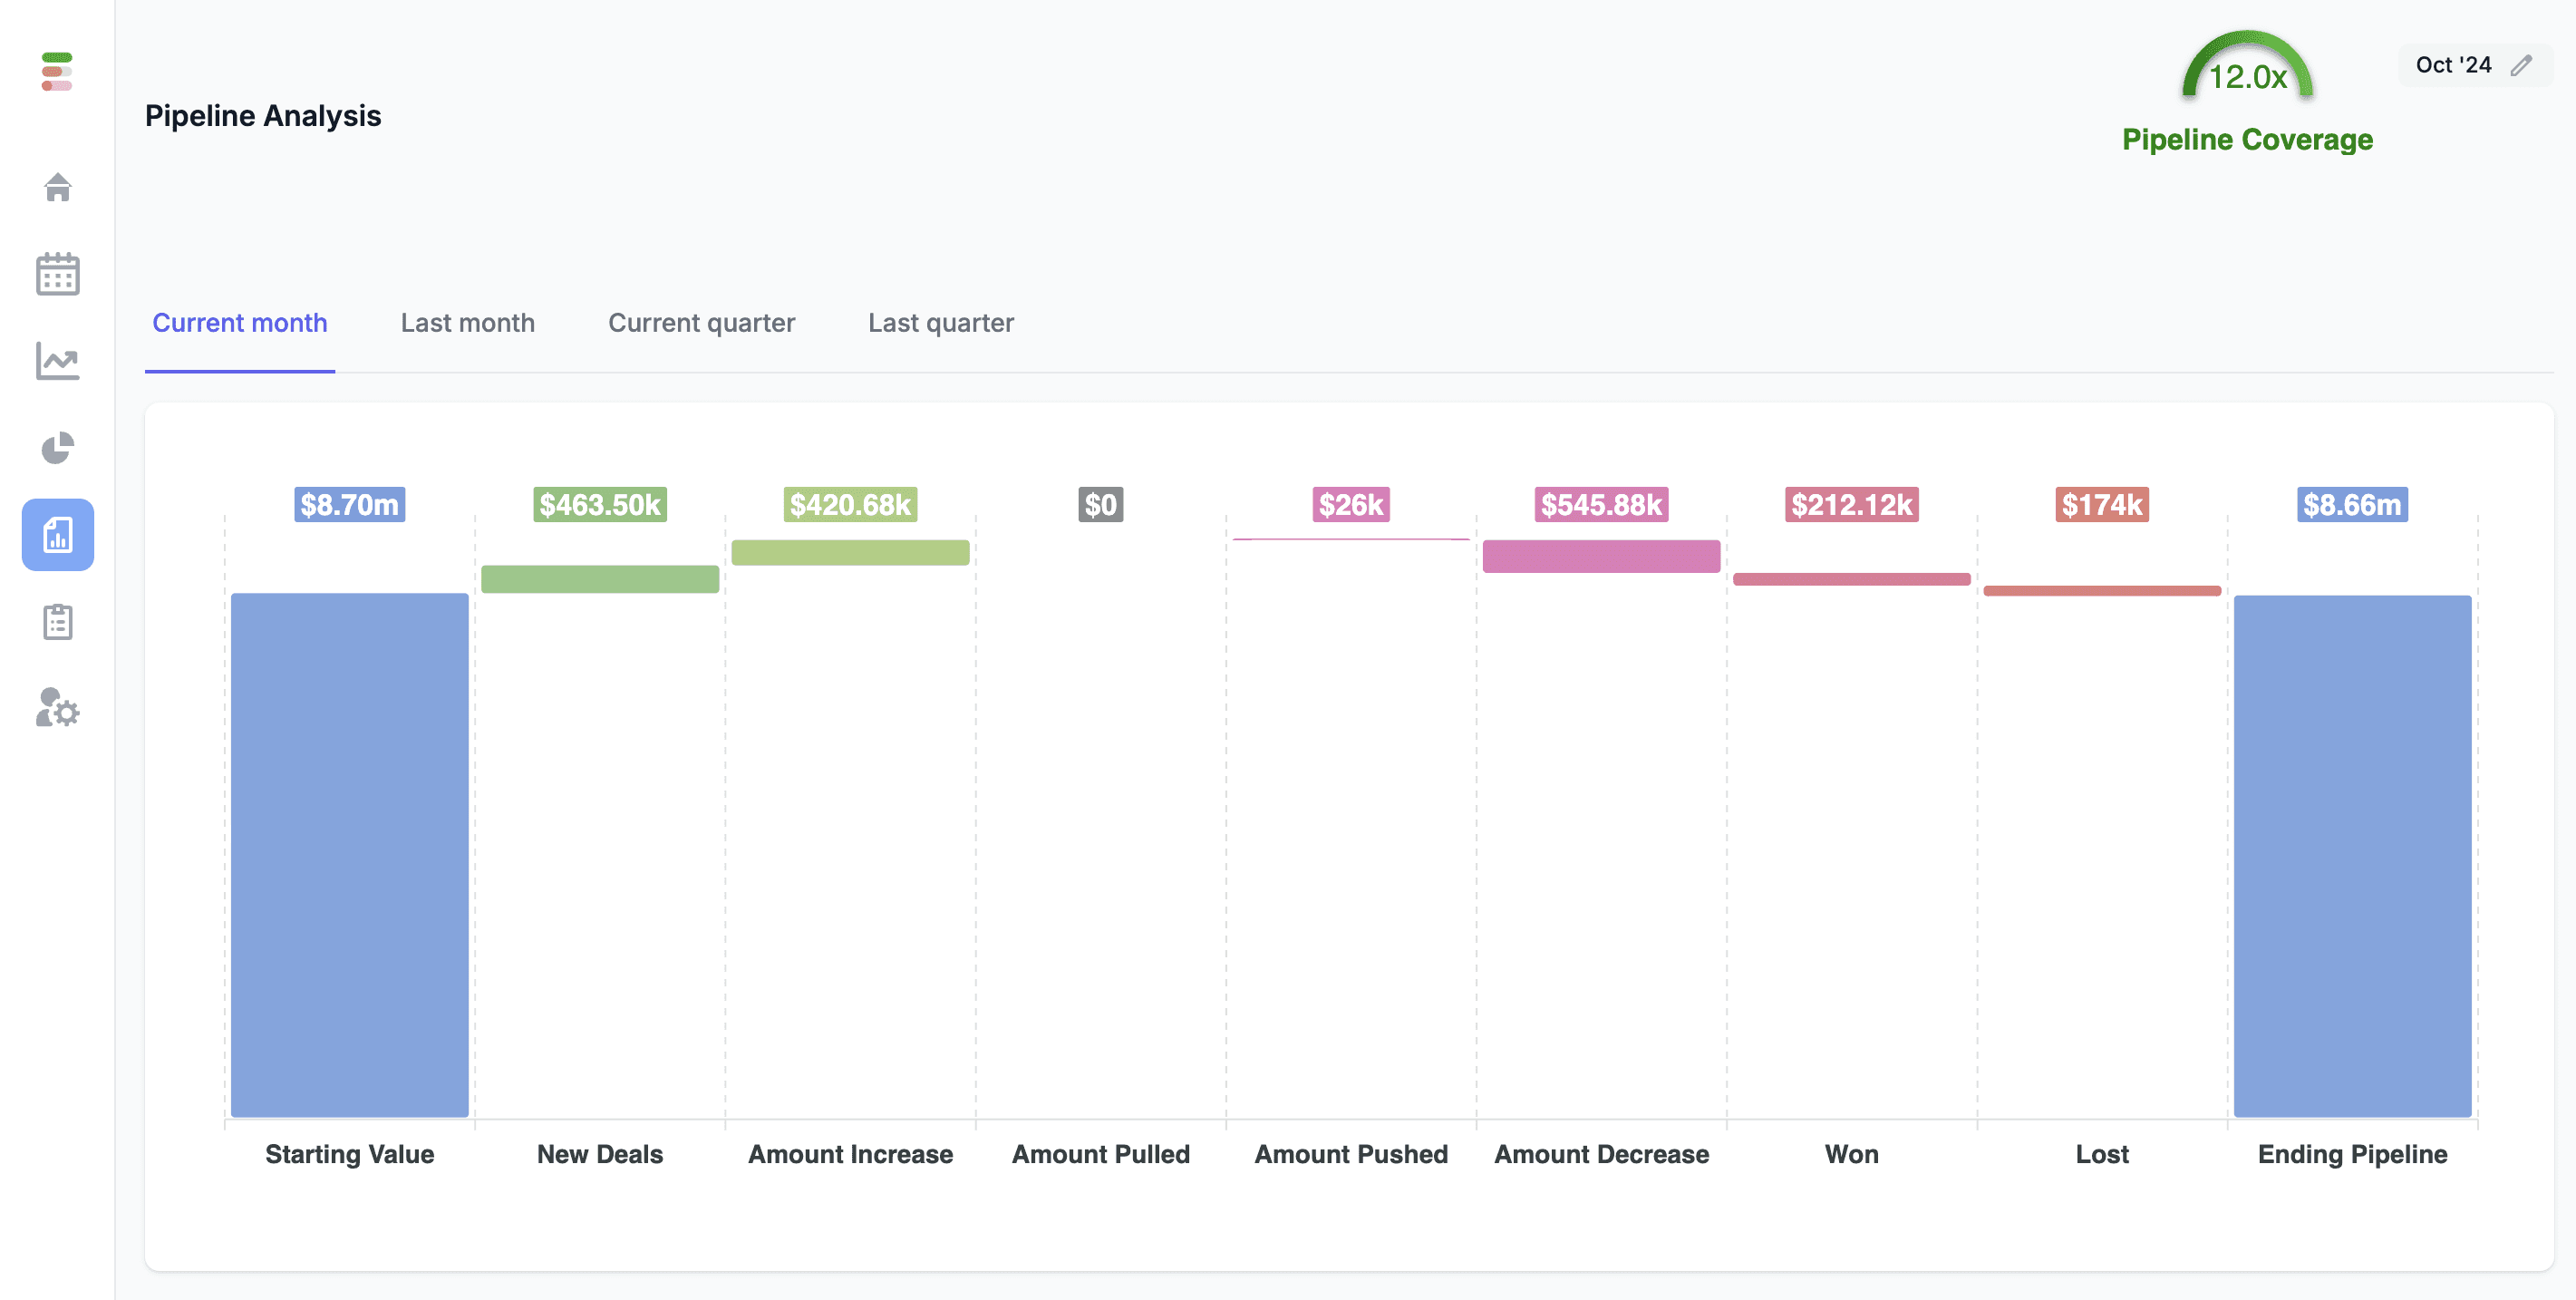
See deals move through different pipeline stages to get a clear view of potential revenue and identify bottlenecks. This dashboard helps sales teams see which deals will close and where they need support. By visualizing deal stages, you can prioritize high-value opportunities and keep your pipeline healthy.
Key Features:
Deal Stages: See the number of deals at each pipeline stage.
Deal Value: See the total value of deals at each stage to see revenue potential.
Pipeline Coverage: See the ratio between current pipeline value and sales targets.
Ensure your pipeline is strong enough to hit your targets — use our Pipeline Coverage Calculator and gain insights to stay on track.
Benefits:
Revenue Insights: See and prioritize big revenue opportunities.
Bottleneck Identification: Quickly detect where deals are stalled.
4. Lead conversion dashboard
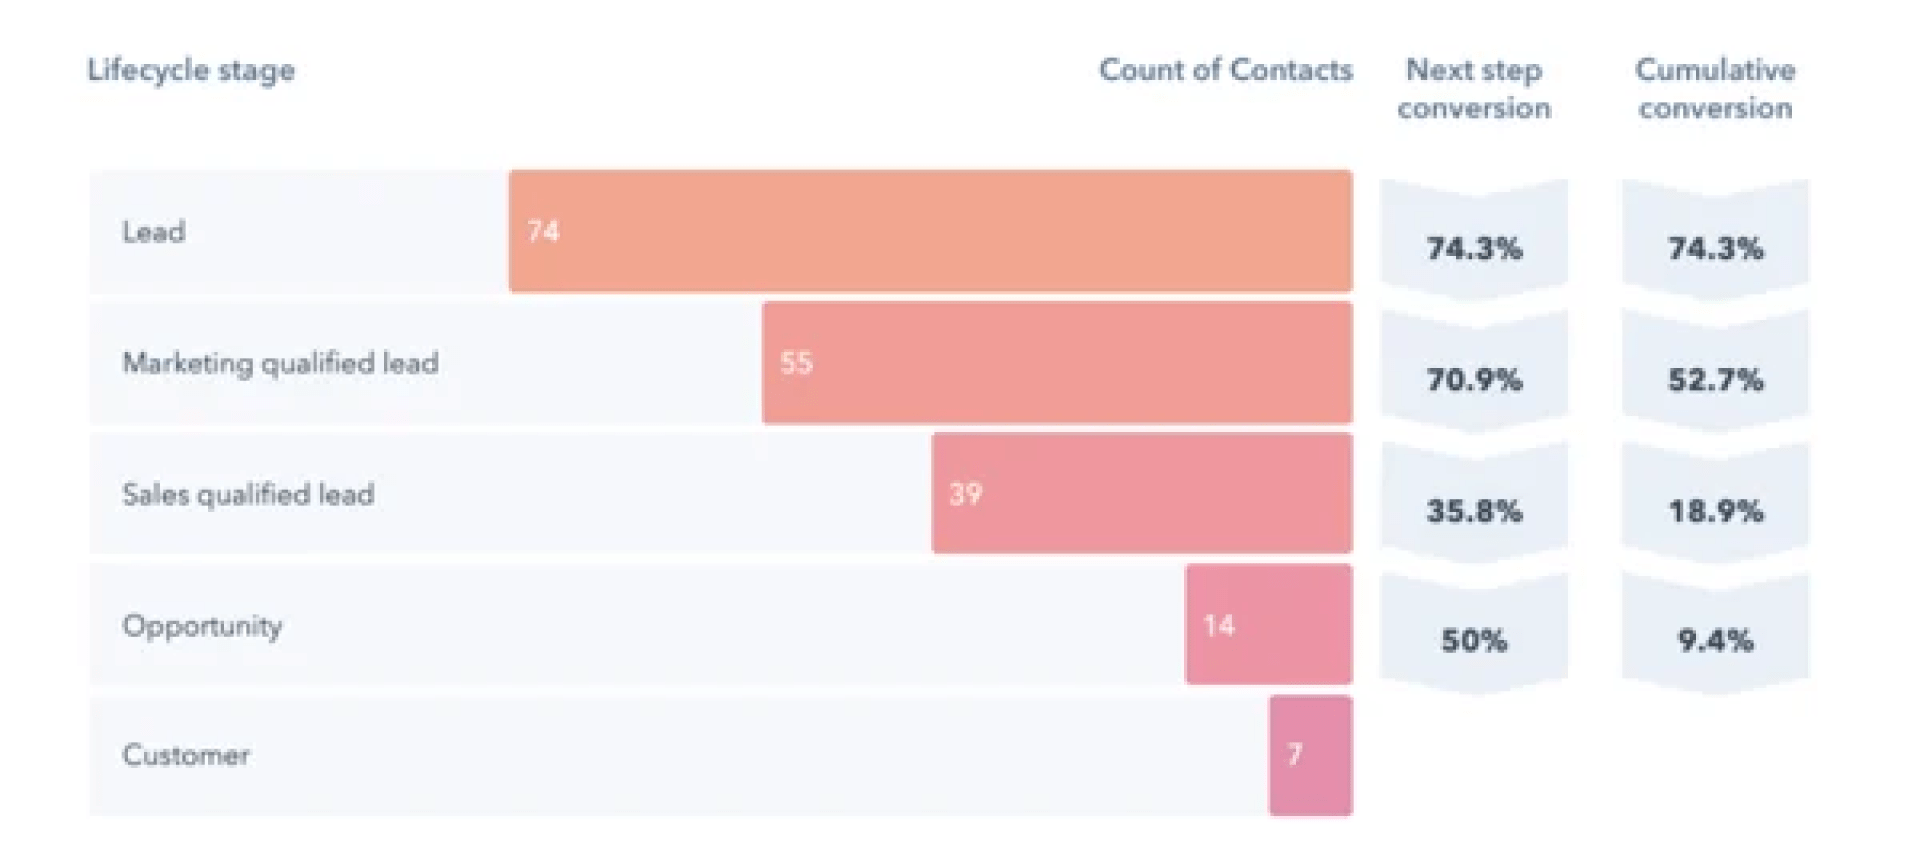
See how your lead conversion is working by tracking metrics around lead engagement, conversion rates, and touchpoints. This dashboard helps sales and marketing teams see which lead sources are driving the most conversions so they can refine their lead nurturing. By optimizing lead conversion you can increase overall sales success.
Key Features:
Lead Tracking: See the journey of leads from first contact to conversion.
Conversion Rate Metrics: See the percentage of leads that become customers.
Engagement Insights: See the touchpoints that lead to conversions.
Filter Activities: Use the dropdown to filter activities by period to see trends and performance over time.
Benefits:
Optimize Lead Nurturing: See which touchpoints are driving conversion.
Improve Conversion Rates: Use data to refine your lead engagement strategy.
5. Deal Velocity dashboard
See how fast deals move through the pipeline to identify bottlenecks and areas to improve. By seeing how deals progress you can see which stages need extra attention and improve overall deal velocity. Faster deal velocity means shorter sales cycles so your team can close deals faster and get cash in the bank.
Key Features:
Time Tracking: See the time deals spend at each pipeline stage.
Deal Progression Metrics: See the average time deals are in each phase.
Bottleneck Identification: See where the sales process is slowing down.
Benefits:
Be More Efficient: Reduce the time it takes to close deals by fixing slow stages.
Identify Blockages: See and fix pipeline inefficiencies quickly.
6. Revenue attribution dashboard
See the impact of different sales activities and channels on your revenue. This dashboard helps sales leaders see which campaigns or channels are driving the most revenue so they can allocate budget smarter. By attributing revenue to specific actions you can see what to replicate for continued growth.
Key Features:
Channel Analysis: See revenue from different sales channels.
Activity Attribution: Attribute closed deals to specific activities or campaigns.
Performance Metrics: See how different sales efforts are performing.
Benefits:
Data-Driven Decisions: Allocate resources based on revenue contribution.
Optimize Campaigns: See which channels and activities to repeat.
7. Customer retention dashboard
See customer retention metrics to ensure your sales efforts lead to long-term success and customer satisfaction. This dashboard shows churn rates, customer lifetime value, and overall retention performance. By focusing on retention you can create strategies to increase customer loyalty and recurring revenue.
Key Features:
Churn Rate Analysis: See how many customers are leaving.
Customer Lifetime Value (CLV): See total revenue from each customer.
Retention Metrics: See how retention strategies are performing over time.
Benefits:
Reduce Churn: See at-risk customers and take action to retain them.
Increase Lifetime Value: Focus on strategies that increase customer satisfaction and loyalty.
8. Sales forecasting dashboard
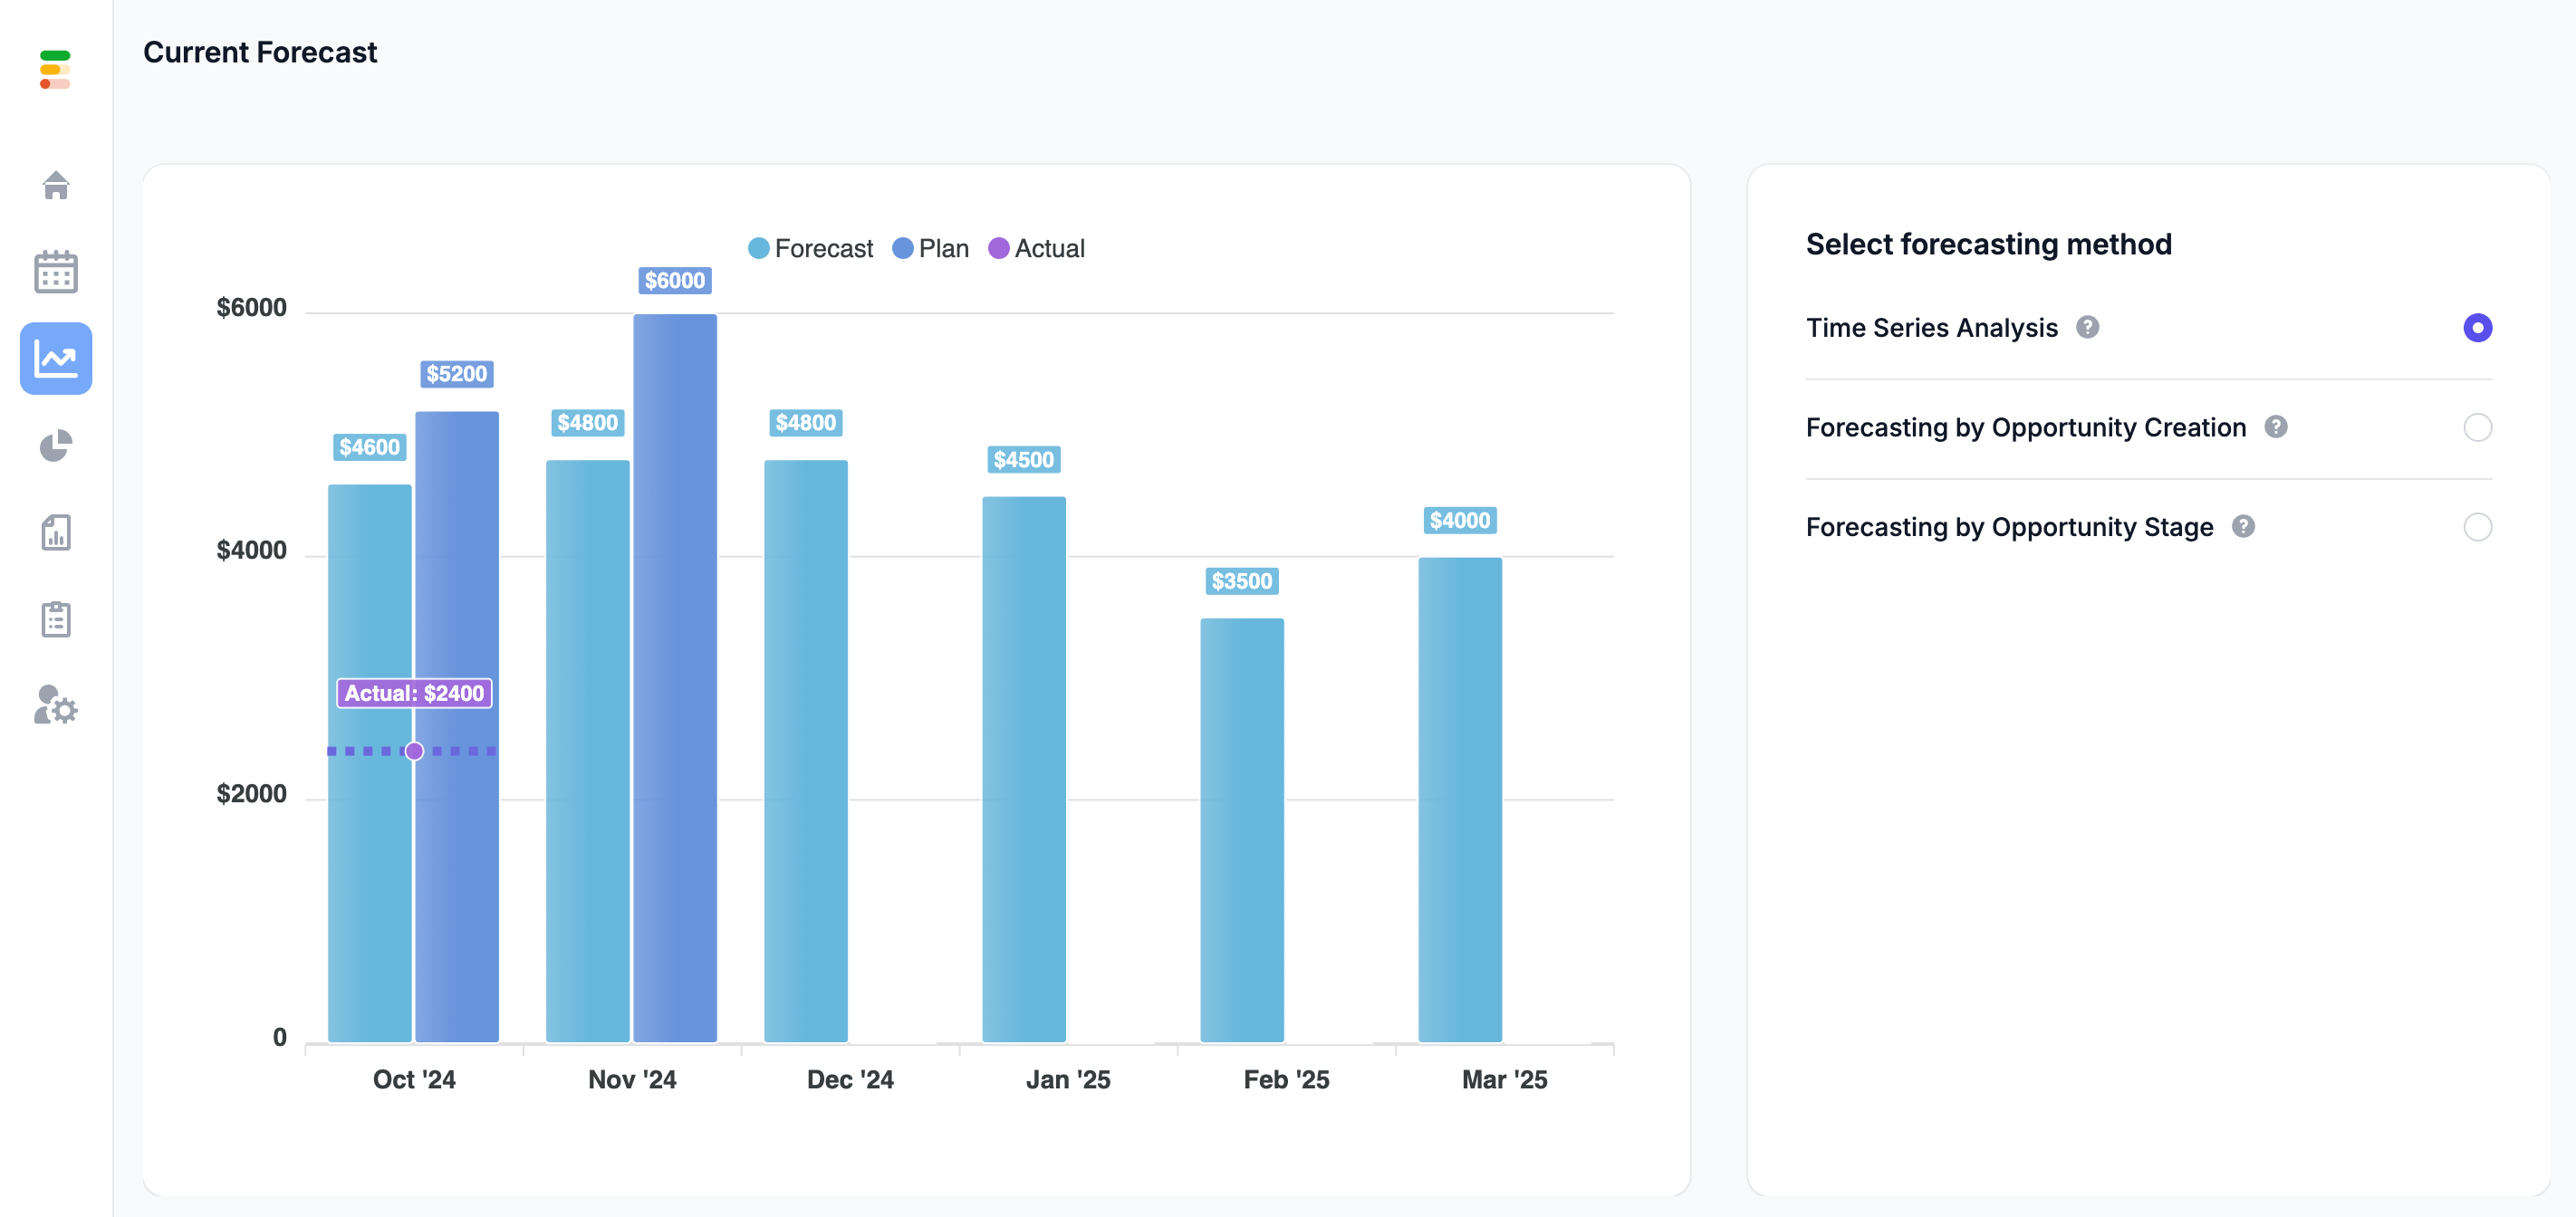
Use predictive analytics to forecast future sales performance based on historical data and pipeline health. This dashboard uses advanced data models to help sales leaders forecast accurately and make informed decisions on resource allocation. See sales forecasts so you can set realistic goals and plan for growth.
Key Features:
Predictive Metrics: Use AI-driven insights to forecast future sales performance with pre-built templates and reports from the dashboard library.
Pipeline Health Analysis: See the health of your current pipeline to forecast accurately.
Scenario Planning: Model different scenarios to see what if.
Benefits:
Better Planning: Align sales targets to forecasts so goals are achievable.
Resource Allocation: Plan team resources based on sales trends.
9. Team performance dashboard
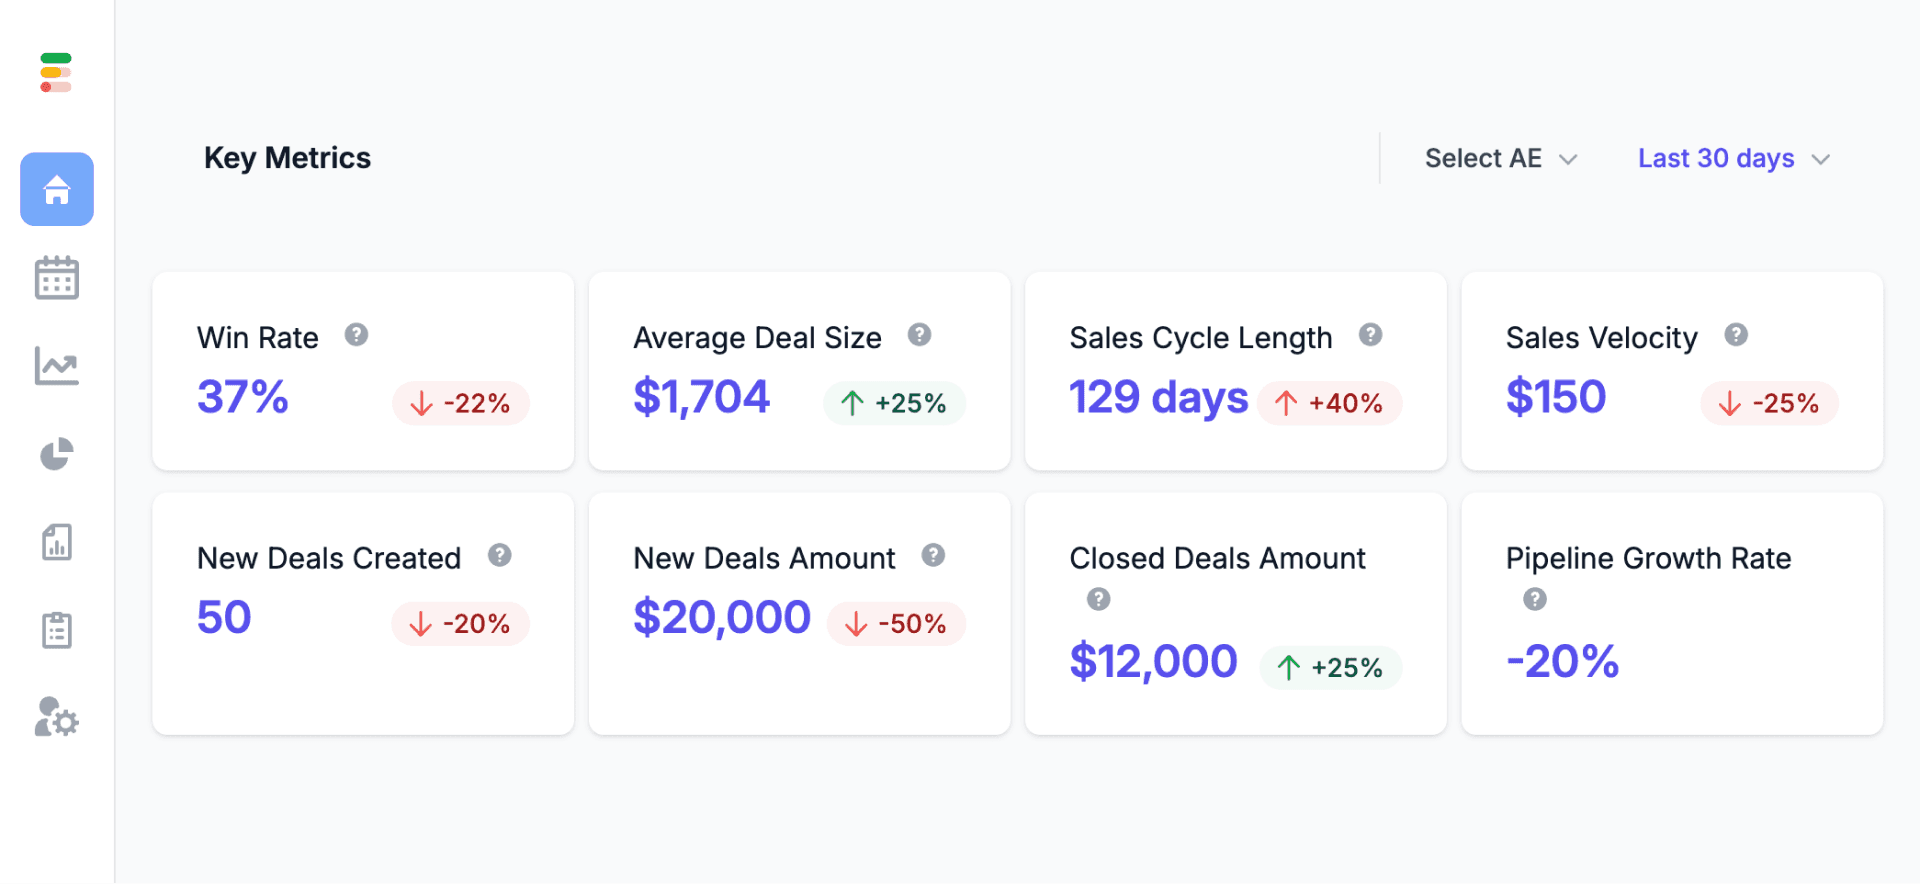
See how your entire sales team is performing with metrics like activity levels, deal progress, and quota attainment. This dashboard will show you top performers, areas to improve, and overall team health. By seeing team performance you can coach specifically and ensure everyone is aligned to company sales goals.
Key Features:
Quota Tracking: See individual and team quota attainment.
Activity Metrics: See activity levels to ensure everyone is engaged.
Deal Success Rate: See the success rate of deals closed by each team member.
Benefits:
See Top Performers: Recognize high performers and what they’re doing right.
Targeted Coaching: Use data to coach underperforming reps.
10. Custom sales dashboard
Create a custom sales dashboard that suits your business needs, combining data from across the sales funnel. This gives you complete flexibility to add metrics that match your company’s sales strategy and change as those needs change. It also promotes team collaboration by sharing critical sales data.
Key Features:
Drag-and-Drop Editor: Add widgets and metrics that matter to your sales goals.
Multiple Data Sources: Connect data from marketing, sales, and customer service.
Personalized Reports: Generate reports for individual reps, teams, or specific business metrics.
Benefits:
Flexible: Change the dashboard as your business and sales process evolves.
Team Collaboration: Share dashboards with your team to ensure everyone is on the same page.
How to create a HubSpot sales dashboard
Creating a sales dashboard in HubSpot is straightforward with the custom report builder. It allows you to create customized reporting dashboards tailored to your specific business needs. Here’s how:
Step 1: Set your sales goals
What are the metrics that matter to your sales goals, e.g. monthly revenue, sales activities, or pipeline value?
Step 2: Use the report builder
Go to the HubSpot dashboard and use the custom report builder to add widgets for your metrics. Choose from pre-built templates or create your own.
Step 3: Customize the dashboard
Use the drag-and-drop editor to customize the layout. Add or remove metrics, adjust colors, and rearrange widgets for visual appeal and easy navigation.
Step 4: Set permissions
Set who can view and edit the dashboard by setting user permissions so sensitive sales data is only visible to the right team members.
Step 5: Save and share
Save the dashboard and share it with your team. Review during sales meetings to keep everyone informed and adjust as needed.
Real-world examples of Forecastio sales performance dashboard
Example 1: Enhancing forecast accuracy with advanced sales forecasting
A VP of Sales at a B2B SaaS company used Forecastio’s advanced sales forecasting to improve forecast accuracy. By using AI-driven insights and historical HubSpot data, they increased forecast accuracy by 20% and were able to better resource allocation and strategic planning.
Example 2: Identifying performance gaps with sales performance insights
A Sales Director used Forecastio’s sales performance insights to find bottlenecks in the sales process. The platform showed him pipeline stages and lead sources were the issue, and he was able to implement targeted strategies that resulted in a 15% increase in win rates.
Example 3: Optimizing sales capacity with sales planning automation
A Sales Manager used Forecastio’s sales planning automation to see current sales capacity and build a hiring plan. By aligning sales capacity to quota attainment goals he increased team efficiency and got a 10% increase in quota attainment.
Best practices for using HubSpot sales dashboards
Review Regularly: Make reviewing your sales dashboard a habit during weekly meetings.
Use Visual Cues: Highlight key metrics with colors to make the dashboard more obvious.
Involve Your Team: Get reps to create their dashboards to track their progress and stay motivated.
Optimize with Data: Adjust your dashboards based on what the data tells you. Remove metrics that don’t add value and focus on what drives results.
Benchmark Against Others: Benchmark your sales metrics against industry standards so your team is performing at the right level.
Automate: Automate data updates and reporting where you can so your sales dashboards are always up-to-date and error-free.
Conclusion
HubSpot sales dashboards are for B2B sales leaders who want to use data to make decisions, track progress, and improve performance. Whether you manage a whole team or an individual rep, these dashboards will give you the visibility you need.
By customizing your HubSpot dashboards to your sales process you can make sure your team is on track, every sales activity is accounted for and your revenue goals are met.
With Forecastio, you can take your sales performance tracking to the next level with AI-driven insights and see all key metrics on a single dashboard.
Interested in learning more about HubSpot sales dashboards and Forecastio? Book a demo with Forecastio now.
In today’s data-obsessed sales world, visualizing complex sales data is key to tracking progress, optimizing processes, and making informed decisions. HubSpot’s sales dashboards give you a centralized platform to monitor key performance indicators (KPIs), measure team performance, and drive revenue growth. With the ability to create custom reporting dashboards for your business needs, you can tie CRM data to sales and marketing data together. This post looks at 10 HubSpot dashboard examples and provides tips to help you supercharge your sales.
If you’re a sales leader looking to get the most out of HubSpot then this post is for you.
What is a HubSpot Sales Dashboard?
A HubSpot sales dashboard, part of HubSpot’s comprehensive sales reporting tools, is a customizable visualization of key sales metrics and performance data. It helps teams monitor activity, measure progress, and stay aligned with revenue targets. By connecting data from sales, marketing, and customer service, these dashboards give teams a complete 360° view of their pipeline and sales performance.
When implemented effectively, a HubSpot sales dashboard becomes more than just a reporting tool — it’s a strategic command center. By following sales dashboard best practices, businesses can design dashboards that deliver meaningful insights at a glance. For example, clear HubSpot dashboard examples often include metrics like deal velocity, conversion rates, and forecast accuracy, helping sales leaders identify where to focus their team’s effort.
Looking through different HubSpot sales dashboard examples or sales dashboard samples can also inspire better layout and data visualization choices. A well-structured dashboard allows teams to act on trends quickly, improving forecasting accuracy and decision-making.
Tools like Forecastio take this a step further by integrating directly with HubSpot to transform dashboard insights into predictive, AI-driven forecasts. With up to 95% forecast accuracy, Forecastio enables sales leaders to move from static sales dashboard examples to dynamic, real-time forecasting that powers confident, data-backed revenue planning.
Why use HubSpot sales dashboards?
Centralized Data: Tie all your sales, marketing, and customer service data together in one place for a complete view of performance.
Custom Reporting: Create reports for your business needs to visualize and analyze data.
Real-Time Insights: Monitor metrics in real time to adjust fast.
Actionable Insights: Identify areas of improvement and coach your reps effectively.
→ Dashboards work best when you clearly understand your pipeline stages. Read more about HubSpot sales pipeline stages.
HubSpot sales dashboard benefits
HubSpot sales dashboards are a must-have for sales teams in today’s sales operations. Here are the benefits:
More Visibility: HubSpot sales dashboards give you a full view of the sales process so your sales team can track progress and performance easily. By visualizing key metrics sales leaders can see trends and areas to focus on.
Better Decision Making: With real-time data and insights at their fingertips sales teams can make decisions fast. HubSpot’s sales reporting tools ensure the data is always up to date so you can adjust fast.
More Productivity and Efficiency: Streamlined reporting and analytics save time and reduce manual effort to get the data. Sales teams can focus more on selling and less on admin tasks, and overall productivity will increase.
More Aligned to Sales Goals: Customizable dashboards and reports allow sales teams to align their activity to overall sales goals and objectives. By customizing the dashboards to your business needs teams can stay focused on what matters most.
Better Collaboration and Communication: Shared dashboards and reports mean better communication and collaboration between sales teams. Everyone is on the same page so efforts are coordinated and team members are working towards the same goals.
By using HubSpot sales dashboards sales teams can perform better, simplify their processes, and get better results.

Essential components of a sales dashboard
A good sales dashboard is key to giving you a clear and complete view of sales performance. Here are the essentials:
Sales performance metrics
Sales performance metrics are vital for understanding how well the sales team is performing and progressing towards their goals. Key metrics to include are:
Sales Revenue and Growth Rate: Track the total revenue generated and the growth rate over time to assess overall performance.
Conversion Rates and Sales Velocity: Measure the percentage of leads that convert to customers and the speed of deals moving through the sales pipeline.
Sales Pipeline and Funnel Analysis: Analyze the stages of the sales pipeline to see where the bottlenecks and opportunities to improve.
Sales Team Performance and Ranking: Measure individual and team performance to see who’s performing and who needs support.
Discover how your business is growing with our Growth Rate Calculator — analyze trends and optimize strategies with Forecastio.
Sales activity tracking
Sales activity tracking gives you insight into what the sales team is doing daily. Monitor:
Number of Calls, Emails, and Meetings: Monitor the volume of outreach to ensure prospect engagement.
Time Spent on Sales Activities: See how much time reps are spending on different activities to see where to improve efficiency.
Sales Activity Completion Rates and Productivity: Measure the completion rates of scheduled activities and overall productivity to see if the team is on track.
Sales forecasting and pipeline management
Forecasting and pipeline management are key to predicting future performance and a healthy pipeline. Key metrics to include are:
Sales Pipeline and Funnel Analysis: Monitor the pipeline health to ensure a constant flow of opportunities.
Deal Stage and Probability Analysis: See the probability of deals closing at each stage of the pipeline to focus efforts.
Sales Forecasting and Revenue Projections: Use historical data and the current pipeline to forecast future sales and set realistic goals.
Pipeline Management and Optimization: Review and optimize the pipeline regularly to remove bottlenecks and improve deal velocity.
Evaluate the vitality of your sales funnel — try our Pipeline Health Score Calculator to gain actionable insights and drive better sales outcomes.
By including these essentials a sales dashboard will give you a complete view of the sales team’s performance and progress so you can make data-driven decisions and get better sales results.
How Forecastio Enhances HubSpot Forecasting Dashboards
HubSpot gives you a solid starting point for tracking pipeline and forecast numbers, but Forecastio adds the level of depth sales leaders actually need. It introduces forecasting dashboards that show accuracy trends over time, highlight where forecasts were over- or under-estimated, and reveal patterns across teams or segments. You also get a clear audit trail, so you can instantly see who changed the forecast, when it happened, and how it affected the final number. Together, these insights make your HubSpot forecasting process more transparent, more predictable, and much easier to trust.

Comprehesive Forecast Audit Trail with Forecastio
Types of HubSpot sales dashboards
1. Sales performance dashboard

Track overall sales performance with metrics like total revenue, closed deals, deal value, and conversion rates. This dashboard helps sales leaders see key sales metrics so they can see how the team is performing and growing. By looking at performance holistically you can see what’s working and what needs to improve.
Key Features:
Revenue Tracking: Monitor monthly or quarterly revenue to hit targets.
Pipeline Visibility: See the number of deals at each stage of the pipeline.
Sales Rep Performance: Measure individual sales rep performance on deals closed and meetings booked. This includes metrics like monthly progress and average deal size to see how they’re performing and to create competition between team members.
Benefits:
Holistic View: Get a top-level view of your sales team’s performance.
Identify Gaps: See where deals are stuck in the pipeline.
Drive your revenue growth with our in-depth guide to sales performance analysis, featuring actionable metrics and insights to fine-tune your team’s effectiveness.
2. Sales activities dashboard

Focus on sales team activity including calls, emails, meetings, and tasks to ensure prospect engagement. This dashboard gives you a detailed view of each rep’s productivity so you can hold the team accountable and make data-driven changes to your outreach strategy. With real-time activity tracking and sales analytics you can see what’s working.
Key Features:
Activity Tracking: See all completed activities including calls, emails, and meetings.
Custom Date Range: Filter activities by specific periods.
Engagement Metrics: Use sales analytics to see how reps are engaging with prospects and customers.
Benefits:
Accountability: Hold reps accountable by tracking daily activity.
Engagement Analysis: See which activities are driving higher conversion rates.
3. Sales pipeline dashboard

See deals move through different pipeline stages to get a clear view of potential revenue and identify bottlenecks. This dashboard helps sales teams see which deals will close and where they need support. By visualizing deal stages, you can prioritize high-value opportunities and keep your pipeline healthy.
Key Features:
Deal Stages: See the number of deals at each pipeline stage.
Deal Value: See the total value of deals at each stage to see revenue potential.
Pipeline Coverage: See the ratio between current pipeline value and sales targets.
Ensure your pipeline is strong enough to hit your targets — use our Pipeline Coverage Calculator and gain insights to stay on track.
Benefits:
Revenue Insights: See and prioritize big revenue opportunities.
Bottleneck Identification: Quickly detect where deals are stalled.
4. Lead conversion dashboard

See how your lead conversion is working by tracking metrics around lead engagement, conversion rates, and touchpoints. This dashboard helps sales and marketing teams see which lead sources are driving the most conversions so they can refine their lead nurturing. By optimizing lead conversion you can increase overall sales success.
Key Features:
Lead Tracking: See the journey of leads from first contact to conversion.
Conversion Rate Metrics: See the percentage of leads that become customers.
Engagement Insights: See the touchpoints that lead to conversions.
Filter Activities: Use the dropdown to filter activities by period to see trends and performance over time.
Benefits:
Optimize Lead Nurturing: See which touchpoints are driving conversion.
Improve Conversion Rates: Use data to refine your lead engagement strategy.
5. Deal Velocity dashboard
See how fast deals move through the pipeline to identify bottlenecks and areas to improve. By seeing how deals progress you can see which stages need extra attention and improve overall deal velocity. Faster deal velocity means shorter sales cycles so your team can close deals faster and get cash in the bank.
Key Features:
Time Tracking: See the time deals spend at each pipeline stage.
Deal Progression Metrics: See the average time deals are in each phase.
Bottleneck Identification: See where the sales process is slowing down.
Benefits:
Be More Efficient: Reduce the time it takes to close deals by fixing slow stages.
Identify Blockages: See and fix pipeline inefficiencies quickly.
6. Revenue attribution dashboard
See the impact of different sales activities and channels on your revenue. This dashboard helps sales leaders see which campaigns or channels are driving the most revenue so they can allocate budget smarter. By attributing revenue to specific actions you can see what to replicate for continued growth.
Key Features:
Channel Analysis: See revenue from different sales channels.
Activity Attribution: Attribute closed deals to specific activities or campaigns.
Performance Metrics: See how different sales efforts are performing.
Benefits:
Data-Driven Decisions: Allocate resources based on revenue contribution.
Optimize Campaigns: See which channels and activities to repeat.
7. Customer retention dashboard
See customer retention metrics to ensure your sales efforts lead to long-term success and customer satisfaction. This dashboard shows churn rates, customer lifetime value, and overall retention performance. By focusing on retention you can create strategies to increase customer loyalty and recurring revenue.
Key Features:
Churn Rate Analysis: See how many customers are leaving.
Customer Lifetime Value (CLV): See total revenue from each customer.
Retention Metrics: See how retention strategies are performing over time.
Benefits:
Reduce Churn: See at-risk customers and take action to retain them.
Increase Lifetime Value: Focus on strategies that increase customer satisfaction and loyalty.
8. Sales forecasting dashboard

Use predictive analytics to forecast future sales performance based on historical data and pipeline health. This dashboard uses advanced data models to help sales leaders forecast accurately and make informed decisions on resource allocation. See sales forecasts so you can set realistic goals and plan for growth.
Key Features:
Predictive Metrics: Use AI-driven insights to forecast future sales performance with pre-built templates and reports from the dashboard library.
Pipeline Health Analysis: See the health of your current pipeline to forecast accurately.
Scenario Planning: Model different scenarios to see what if.
Benefits:
Better Planning: Align sales targets to forecasts so goals are achievable.
Resource Allocation: Plan team resources based on sales trends.
9. Team performance dashboard

See how your entire sales team is performing with metrics like activity levels, deal progress, and quota attainment. This dashboard will show you top performers, areas to improve, and overall team health. By seeing team performance you can coach specifically and ensure everyone is aligned to company sales goals.
Key Features:
Quota Tracking: See individual and team quota attainment.
Activity Metrics: See activity levels to ensure everyone is engaged.
Deal Success Rate: See the success rate of deals closed by each team member.
Benefits:
See Top Performers: Recognize high performers and what they’re doing right.
Targeted Coaching: Use data to coach underperforming reps.
10. Custom sales dashboard
Create a custom sales dashboard that suits your business needs, combining data from across the sales funnel. This gives you complete flexibility to add metrics that match your company’s sales strategy and change as those needs change. It also promotes team collaboration by sharing critical sales data.
Key Features:
Drag-and-Drop Editor: Add widgets and metrics that matter to your sales goals.
Multiple Data Sources: Connect data from marketing, sales, and customer service.
Personalized Reports: Generate reports for individual reps, teams, or specific business metrics.
Benefits:
Flexible: Change the dashboard as your business and sales process evolves.
Team Collaboration: Share dashboards with your team to ensure everyone is on the same page.
How to create a HubSpot sales dashboard
Creating a sales dashboard in HubSpot is straightforward with the custom report builder. It allows you to create customized reporting dashboards tailored to your specific business needs. Here’s how:
Step 1: Set your sales goals
What are the metrics that matter to your sales goals, e.g. monthly revenue, sales activities, or pipeline value?
Step 2: Use the report builder
Go to the HubSpot dashboard and use the custom report builder to add widgets for your metrics. Choose from pre-built templates or create your own.
Step 3: Customize the dashboard
Use the drag-and-drop editor to customize the layout. Add or remove metrics, adjust colors, and rearrange widgets for visual appeal and easy navigation.
Step 4: Set permissions
Set who can view and edit the dashboard by setting user permissions so sensitive sales data is only visible to the right team members.
Step 5: Save and share
Save the dashboard and share it with your team. Review during sales meetings to keep everyone informed and adjust as needed.
Real-world examples of Forecastio sales performance dashboard
Example 1: Enhancing forecast accuracy with advanced sales forecasting
A VP of Sales at a B2B SaaS company used Forecastio’s advanced sales forecasting to improve forecast accuracy. By using AI-driven insights and historical HubSpot data, they increased forecast accuracy by 20% and were able to better resource allocation and strategic planning.
Example 2: Identifying performance gaps with sales performance insights
A Sales Director used Forecastio’s sales performance insights to find bottlenecks in the sales process. The platform showed him pipeline stages and lead sources were the issue, and he was able to implement targeted strategies that resulted in a 15% increase in win rates.
Example 3: Optimizing sales capacity with sales planning automation
A Sales Manager used Forecastio’s sales planning automation to see current sales capacity and build a hiring plan. By aligning sales capacity to quota attainment goals he increased team efficiency and got a 10% increase in quota attainment.
Best practices for using HubSpot sales dashboards
Review Regularly: Make reviewing your sales dashboard a habit during weekly meetings.
Use Visual Cues: Highlight key metrics with colors to make the dashboard more obvious.
Involve Your Team: Get reps to create their dashboards to track their progress and stay motivated.
Optimize with Data: Adjust your dashboards based on what the data tells you. Remove metrics that don’t add value and focus on what drives results.
Benchmark Against Others: Benchmark your sales metrics against industry standards so your team is performing at the right level.
Automate: Automate data updates and reporting where you can so your sales dashboards are always up-to-date and error-free.
Conclusion
HubSpot sales dashboards are for B2B sales leaders who want to use data to make decisions, track progress, and improve performance. Whether you manage a whole team or an individual rep, these dashboards will give you the visibility you need.
By customizing your HubSpot dashboards to your sales process you can make sure your team is on track, every sales activity is accounted for and your revenue goals are met.
With Forecastio, you can take your sales performance tracking to the next level with AI-driven insights and see all key metrics on a single dashboard.
Interested in learning more about HubSpot sales dashboards and Forecastio? Book a demo with Forecastio now.
Share:

Dmytro is a seasoned marketing professional with over 10 years in the B2B and startup ecosystem. He is passionate about helping companies better plan their revenue goals, improve forecast accuracy, and proactively address performance bottlenecks or seize growth opportunities.
Dmytro is a seasoned marketing professional with over 10 years in the B2B and startup ecosystem. He is passionate about helping companies better plan their revenue goals, improve forecast accuracy, and proactively address performance bottlenecks or seize growth opportunities.
Related articles
Nov 20, 2025
12 min
Nov 20, 2025
12 min
Nov 3, 2025
8 min
Nov 3, 2025
8 min
Sales Forecasting
Oct 15, 2025
10 min
Sales Forecasting
Oct 15, 2025
10 min
Nov 20, 2025
12 min
Nov 3, 2025
8 min
Nov 20, 2025
12 min
Nov 3, 2025
8 min
Sales Planning
Sales Forecasting
Sales Performance Insights
Sales Planning
Sales Forecasting
Sales Performance Insights
Sales Planning
Sales Forecasting
Sales Performance Insights
© 2025 Forecastio, All rights reserved.
Sales Planning
Sales Forecasting
Sales Performance Insights
Sales Planning
Sales Forecasting
Sales Performance Insights
Sales Planning
Sales Forecasting
Sales Performance Insights
© 2025 Forecastio, All rights reserved.
Sales Planning
Sales Forecasting
Sales Performance Insights
Sales Planning
Sales Forecasting
Sales Performance Insights
Sales Planning
Sales Forecasting
Sales Performance Insights
© 2025 Forecastio, All rights reserved.
Sales Planning
Sales Forecasting
Sales Performance Insights
Sales Planning
Sales Forecasting
Sales Performance Insights
Sales Planning
Sales Forecasting
Sales Performance Insights
© 2025 Forecastio, All rights reserved.


