Sales Velocity Explained: How to Calculate It, Increase It, and Use It in Sales Forecasting

Alex Zlotko
CEO at Forecastio

Sales Velocity: Key takeaways
Sales velocity shows how fast your sales team is generating revenue from the sales pipeline. It combines four key metrics: number of opportunities, average deal size, win rate percentage, and sales cycle length. When you calculate this metric, you see how efficiently your sales process turns qualified leads into closed deals.
Unlike many isolated sales metrics, sales velocity measures the full system. It connects pipeline quality, deal value, and execution speed. That is why many sales managers use it as a high-level indicator of business health and future growth.
Research from Gartner shows that organizations with disciplined sales pipeline management achieve significantly higher sales forecasting accuracy and stronger sales performance. Velocity supports that discipline. It forces teams to look at both quantity and quality inside the sales funnel.
Here are the core insights:
Higher sales velocity means faster increasing revenue.
A large pipeline does not guarantee results. Pipeline velocity matters more than raw volume.
Small improvements in win rate, deal size, or sales cycle length can significantly impact total revenue.
Measuring sales velocity helps detect risks early.
In B2B environments with complex deals, especially mid-market and enterprise sales, understanding sales pipeline velocity is critical. It also supports better sales forecasting, since it reflects real momentum in the pipeline.
For teams using platforms like Forecastio, velocity becomes even more powerful when tracked over time and by segment. It becomes a leading signal of future outcomes, not just a backward-looking metric.
What is sales velocity?
Sales velocity shows how quickly your company turns sales opportunities into revenue during a specific time period. It reflects the speed and effectiveness of your sales efforts across the entire customer journey.
In simple terms, it answers this question. How much revenue does your pipeline generate per day, week, or month?
Sales velocity definition
The formal sales velocity definition describes it as the amount of revenue generated within a defined time period, based on active opportunities.
It considers:
The number of opportunities
The average deal value
The win rate
The sales cycle length
It is different from inventory velocity, which measures product turnover. Here, we focus on how quickly sales professionals convert prospective customers into paying customers.
What sales velocity actually measures
Many assume velocity measures speed only. That is not accurate.
Sales velocity measures:
How efficiently your team is converting leads.
How strong your pipeline momentum is.
How quickly revenue flows through your system.
It reflects both conversion rate and execution quality. A high sales velocity number usually signals an efficient sales process and strong alignment between marketing efforts and sales.
The only sales velocity factor that relates to speed directly is sales cycle length, but the other sales velocity factors are equally important.
Focusing only on adding more opportunities without improving quality often leads to low quality leads, more work for sales reps, and slower outcomes.
How to calculate sales velocity?
To calculate sales velocity, you multiply opportunity volume, deal value, and win rate, then divide by cycle length. This simple logic produces a powerful insight into how fast revenue moves through your business.
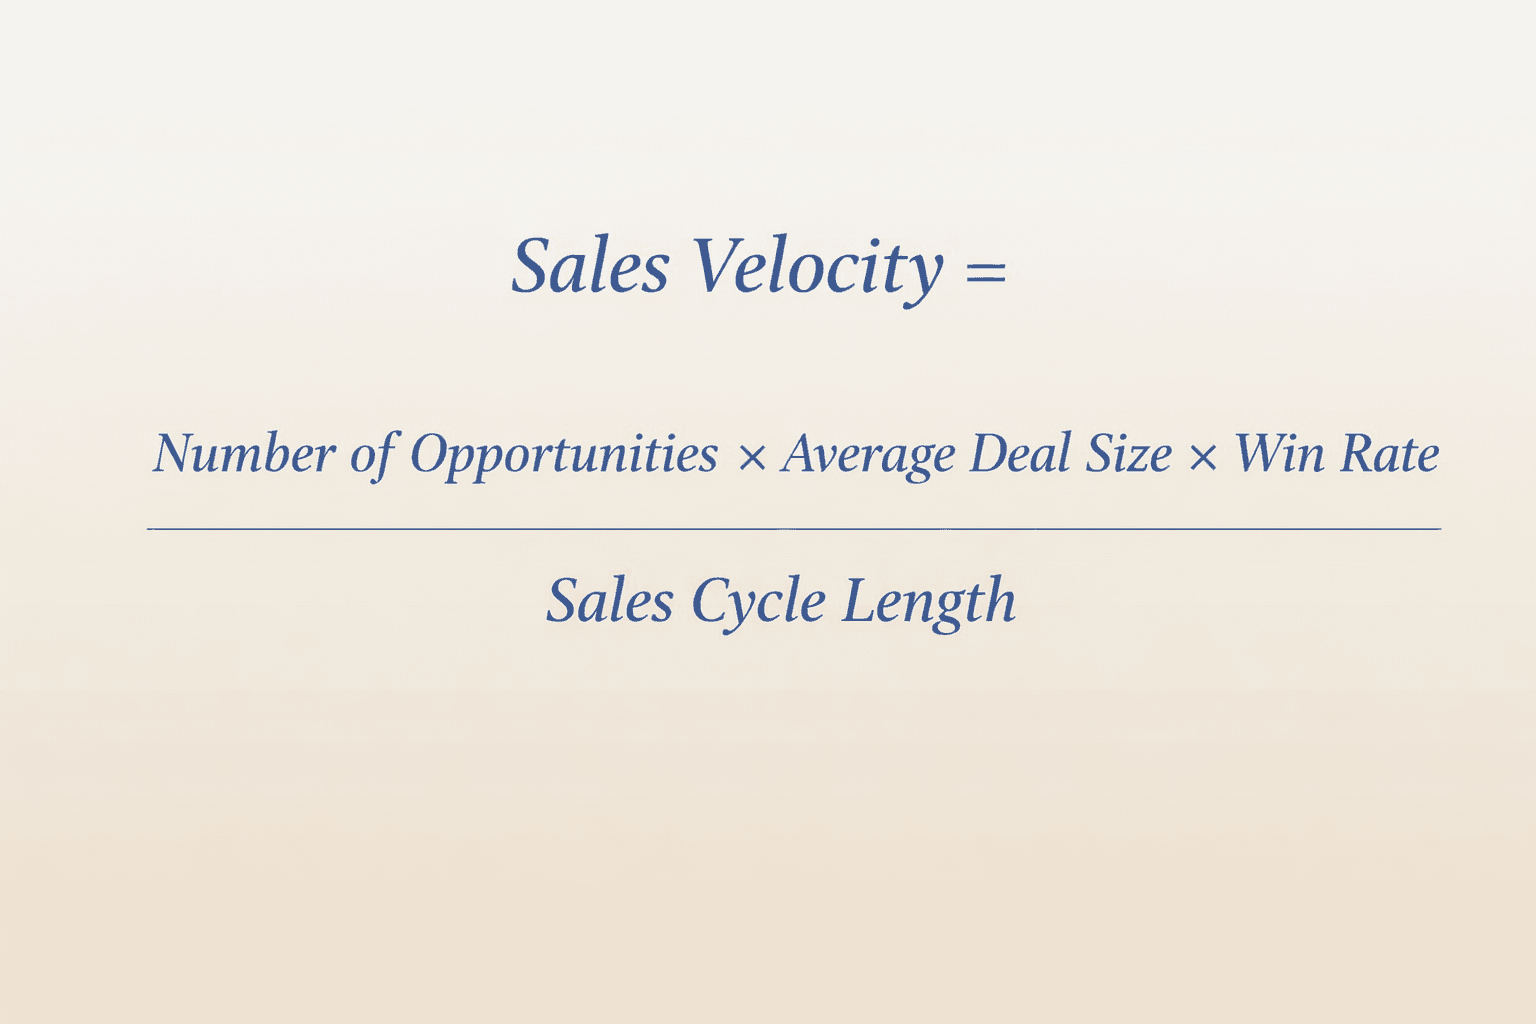
Sales velocity formula
The standard sales velocity formula is:
Sales Velocity = (Number of Opportunities × Average Deal Size × Win Rate) ÷ Sales Cycle Length
This is the core following formula used in B2B companies.
For example:
100 sales opportunities
$10,000 average deal size
20 percent win rate
50-day sales cycle length
Sales Velocity = (100 × 10,000 × 0.2) ÷ 50 = $4,000 per day
This means the pipeline generates $4,000 in average revenue per day.
What each variable influences
Each sales velocity factor plays a specific role:
The number of opportunities reflects pipeline volume.
Average deal value or average monetary value impacts revenue scale.
Win rate percentage reflects execution quality.
Sales cycle length defines speed.
Even small improvements can create a higher sales velocity. For example, increasing win rate from 20 percent to 25 percent often has a larger impact than adding more low-quality leads.
Typical mistakes when calculating sales velocity
Common errors include:
Using incomplete or inaccurate data.
Ignoring lost deals when calculating win rate.
Mixing different segments with very different cycle lengths.
Measuring over a fairly long period without adjustments.
Reliable accurate data from your CRM is essential. This is where platforms like Forecastio help by structuring inputs correctly and avoiding distorted velocity numbers.
Why sales velocity is important
Sales velocity helps leaders understand whether their revenue engine is healthy and scalable. It connects operational performance with financial outcomes.
Revenue predictability
When you monitor sales pipeline velocity, you gain better visibility into future revenue.
If velocity increases steadily, your sales forecasting becomes more reliable. If it slows down, it signals potential revenue gaps.
Velocity also reflects ongoing revenue generation capability, especially in subscription-based models.
Pipeline quality, not just pipeline size
Many teams focus on total opportunity value. That is misleading.
A large pipeline filled with low quality leads creates false confidence. Strong velocity requires:
High quality leads
Strong conversion rate
Clear progression through the sales funnel
This is why sales velocity metrics highlight pipeline efficiency, not just volume.
Early detection of performance issues
Velocity drops often appear before revenue declines.
If sales cycle length increases or win rate decreases, velocity falls. This allows a sales manager to intervene early.
It becomes a health indicator for the entire revenue engine.
According to research published by Harvard Business Review, 40% to 60% of deals are lost because customers fail to make a decision at all, not because they choose a competitor.
This is critical for understanding sales velocity.
When prospects hesitate:
Sales cycle length increases
The win rate percentage drops
The number of stalled sales opportunities grows
All three directly reduce your sales velocity number.
Indecision silently slows down your sales pipeline velocity. The pipeline may look full, but momentum disappears. Revenue is delayed. Forecasts become unreliable.
How to increase sales velocity step-by-step
To increase sales velocity, you must improve at least one of the four core variables. The most sustainable improvements focus on process quality, not shortcuts.
Improve pipeline quality
Start with better qualified leads.
Work closely with marketing to reduce losing prospects early. Filter out low quality leads and focus on buyers with clear sales potential.
A clean pipeline creates a more efficient sales process.
Increase win rates
Improving win rate percentage often delivers the fastest impact.
Focus on:
Stronger discovery at initial contact
Clear qualification criteria
Better alignment with buyer needs
Coaching sales reps on deal strategy can increase sales won without expanding pipeline size.
Shorten the sales cycle
Reducing sales cycle length accelerates cash flow.
You can shorten the average length by:
Removing unnecessary approval steps
Standardizing proposals
Improving follow-up discipline
Even a small reduction improves your sales velocity number.
Increase average deal size carefully
Increasing deal size boosts revenue, but it may extend the cycle.
Focus on upselling and cross-selling when value is clear. Consider impact on average customer lifetime value.
The goal is sustainable increasing revenue, not inflated expectations.
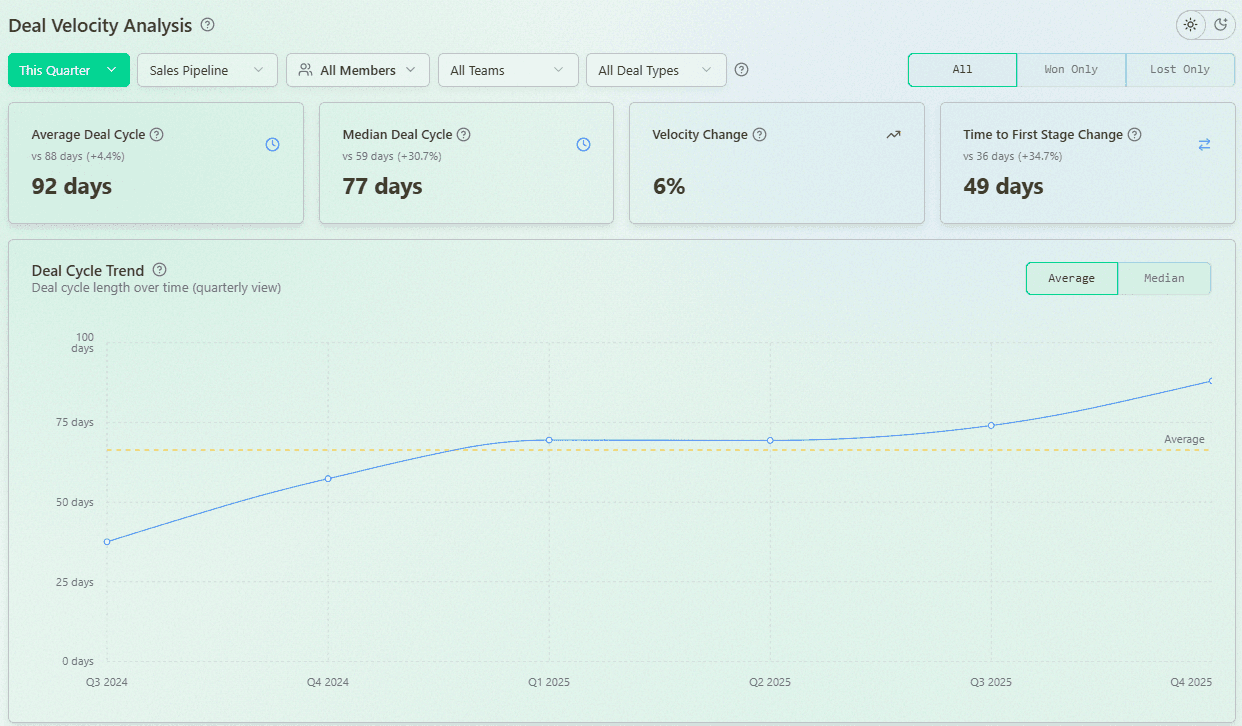
How to track sales velocity
To track sales velocity, you need consistent data and regular measurement across comparable time periods. It should become part of your recurring performance review.
Tracking sales velocity over time
Monitor velocity monthly or quarterly.
Look for trends:
Is pipeline velocity improving?
Is sales cycle length expanding?
Is the average deal value stable?
Trend analysis is more useful than a single snapshot.
Sales velocity by segment
Segment velocity by:
SMB vs enterprise
Product line
Industry
Different segments have different average purchase amounts and average purchase patterns.
Segmented analysis helps allocate sales efforts effectively.
Leading vs lagging indicators
Velocity acts as both.
It is lagging because it uses historical data. It is leading because changes predict shifts in total revenue.
Combined with pipeline stage analysis and close date tracking, velocity strengthens sales forecasting.
Forecastio, for example, allows teams to track sales velocity alongside forecast accuracy to see how operational speed impacts projections.
Sales velocity vs deal velocity
Sales velocity measures revenue generation speed across the full pipeline. Deal velocity focuses on how quickly individual deals move from stage to stage.
Deal velocity is micro. Sales funnel velocity is macro.
Both matter.
If individual deals slow down, overall sales pipeline momentum drops. But you may still have strong revenue if deal values are large.
A balanced view includes:
Deal-level movement
Overall pipeline velocity
Segment-based performance
Using both metrics gives a complete view of sales performance and operational efficiency.
Deal Velocity Report in Forecastio:
Sales velocity in sales forecasting
Velocity plays a critical role in accurate sales forecasting. It reflects how quickly opportunities convert into predictable revenue.
Why sales velocity improves forecast accuracy
When velocity is stable, forecasting becomes easier.
If your team consistently converts a certain number of sales opportunities at a defined win rate, revenue becomes more predictable.
Velocity-based models reduce reliance on subjective forecasts. They rely on measurable data.
Tracking Forecasting Accuracy in Forecastio:
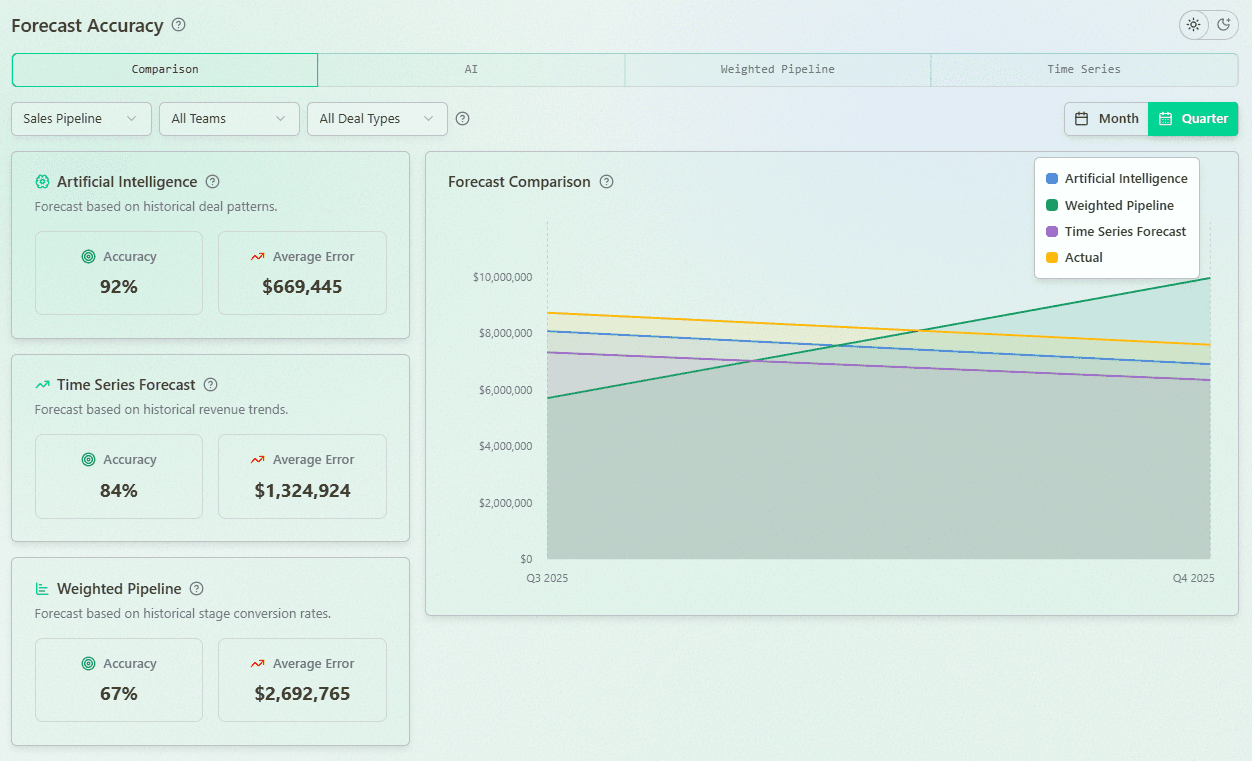
Using velocity to detect forecast risk early
If velocity drops, forecast risk increases.
Common warning signs:
Growing sales cycle
Falling conversion rate
Declining average monetary deal value
Monitoring velocity allows leaders to act before quarterly targets are missed.
How to use sales velocity to forecast sales
You can use sales velocity to project expected revenue for a specific time period.
If your sales velocity number is $4,000 per day, then:
Monthly forecast ≈ $4,000 × 30 = $120,000
Quarterly forecast ≈ $4,000 × 90 = $360,000
This method works well when your sales cycle length, win rate percentage, and number of opportunities are stable. It is especially useful in SMB teams with short cycles and predictable deal flow.
However, from our experience at Forecastio, sales velocity is rarely used as a standalone model in enterprise sales or complex B2B environments.
Why?
Because enterprise forecasting requires:
Deal-level close dates
Individual deal signals
Risk analysis
Large average deal value deals and long sales cycles make aggregate models less reliable. A single slipped deal can change the forecast materially.
That is why we treat sales velocity metrics as a validation layer, not the core sales forecasting engine.
Forecastio integrates sales velocity metrics into forecasting dashboards. This helps identify weak momentum even when pipeline value looks strong.
Sales velocity examples
Real examples show how different teams experience velocity differently.
Example for SMB sales teams
An SMB sales team with short cycles:
200 opportunities
$5,000 average deal size
25 percent win rate
30-day cycle
Velocity = (200 × 5,000 × 0.25) ÷ 30 = $8,333 per day
This reflects fast-moving deals and strong sales productivity.
Example for mid-market and enterprise teams
Enterprise team:
50 opportunities
$50,000 deal value
15 percent win rate
120-day cycle
Velocity = (50 × 50,000 × 0.15) ÷ 120 = $3,125 per day
Although average deal value is higher, longer cycles slow momentum.
What changes when velocity drops
If velocity falls, it often means:
Slower deal progression
Lower win rates
Weak marketing efforts
Poor qualification
Velocity decline signals declining business health and risk to future revenue.
How to improve sales velocity
Improving sales velocity means strengthening your entire sales process, not just adjusting numbers in the sales velocity formula. It requires better qualification, cleaner execution, and fewer delays across the sales pipeline.
While increasing velocity often focuses on metrics like win rate or average deal size, improving velocity is about building a system that consistently converts qualified leads into closed deals faster and more predictably.
It is a strategic shift. Not a mathematical tweak.
Align marketing and sales around quality leads
Velocity improves when your pipeline contains high quality leads, not just more volume.
Sales velocity can be improved by implementing lead generation tactics like gated content and referrals.
If sales reps spend time on weak-fit prospects, the sales cycle length grows and the conversion rate drops.
Define strict qualification criteria. Agree on what a real opportunity looks like. Remove low quality leads early.
Better input leads to faster output and stronger sales performance.
Optimize the sales process to remove delays
An efficient sales process eliminates friction.
Look for bottlenecks between stages. Slow approvals, unclear next steps, and long proposal turnaround times all reduce sales funnel velocity.
Map your customer journey and fix internal delays first. Small process improvements often create measurable increases in higher sales velocity.
Strengthen qualification and discovery
Better discovery increases win rate percentage and protects time.
To improve sales velocity, increase the number of high-quality opportunities in your pipeline.
At initial contact, confirm budget, decision authority, timeline, and real business need.
Strong qualification prevents teams from chasing unlikely deals. That improves sales productivity and increases the number of sales won.
Use data to coach and improve execution
Improvement requires visibility into sales velocity metrics.
Track:
Stage conversion
Changes in average deal value
Trends in sales cycle length
Rep-level win rate
Data-driven coaching helps teams refine sales efforts and protect future revenue.
Tools like Forecastio connect sales velocity with sales forecasting, so leaders can see how execution changes impact projections.
Build buyer confidence to accelerate decisions
Deals move faster when buyers feel confident.
Clarify ROI. Reduce proposal complexity. Remove uncertainty.
When the prospective customer clearly sees value, deals move faster through the sales pipeline, increasing sales velocity without damaging long-term customer lifetime value.
Value-based pricing can increase revenue by 30% or more by adjusting pricing based on business outcomes and market conditions.
Salesforce also highlights the importance of systematically improving sales velocity, noting that even modest gains in conversion rate or reductions in sales cycle length can significantly improve revenue output. Their research s hows that velocity optimization is often more impactful than simply adding more opportunities to the pipeline.
This supports the idea that improving velocity is about building a more efficient sales process, not just increasing volume.
How Forecastio helps track sales velocity
Forecastio helps B2B teams measure sales velocity automatically and consistently.
It connects CRM data with structured forecasting models. Instead of manually applying the sales velocity equation, teams see live dashboards.
Forecastio enables you to:
Monitor sales velocity metrics by pipeline and segment
Compare velocity across different time periods
Detect changes in sales cycle length
Connect velocity trends to forecast accuracy
Because Forecastio focuses on data quality and structured forecasting logic, it ensures accurate data drives decisions.
For growing companies, especially those scaling from SMB to mid-market, tracking velocity becomes essential for sustainable increasing revenue.
When used properly, sales velocity helps leaders align strategy, optimize the sales process, and protect predictable growth.
FAQ
What are the 4 components of sales velocity?
The four components of sales velocity are:
Number of opportunities
Average deal size (or average deal value)
Win rate percentage
Sales cycle length
These variables form the sales velocity formula and directly influence how quickly your sales team is generating revenue. If any of these sales velocity factors change, your overall sales velocity number changes as well. For example, improving the win rate or shortening the sales cycle can significantly increase revenue without adding more opportunities to the sales pipeline.
What is velocity in terms of sales?
In sales, velocity refers to how fast revenue moves through your sales funnel. More specifically, sales velocity measures how efficiently your sales process converts qualified leads into closed deals over a specific time period.
It combines volume, value, and speed. A higher sales velocity means your team is closing deals faster, with a strong conversion rate and healthy average deal size. It is one of the most important sales metrics for understanding overall business health and predicting future revenue.
What is the sales velocity per month?
Sales velocity per month shows how much revenue your pipeline generates in 30 days. To calculate it, you first calculate sales velocity using the standard sales velocity equation, which gives you revenue per day. Then you multiply that number by 30.
For example, if your daily sales velocity is $4,000, your monthly velocity is:
$4,000 × 30 = $120,000
This monthly view helps with sales forecasting, quota planning, and understanding whether your current sales efforts are sufficient for meeting revenue targets.
How to track sales velocity?
To track sales velocity, you need accurate CRM data and consistent measurement across comparable time periods. Start by calculating velocity monthly or quarterly using the following formula:
(Number of Opportunities × Average Deal Size × Win Rate) ÷ Sales Cycle Length
Then monitor trends in:
Sales cycle length
Average deal size
Win rate percentage
Volume of sales opportunities
Segment results by team, region, or product to see where sales velocity helps most. Modern tools like Forecastio allow you to automatically track sales velocity, connect it to sales forecasting, and detect early risks in the sales pipeline velocity before they impact total revenue.
Share: