
Sales Pipeline Analysis in 2026: How to Analyze Metrics, Stages, Gaps, and Forecast Impact

Alex Zlotko
CEO at Forecastio
Last updated
Reading time
12 min
Achieve 95% accuracy in HubSpot forecasting

Sales Pipeline Analysis: Summary
Sales pipeline analysis is the evaluation of how deals move through the sales pipeline, how healthy those deals are, and how likely they are to generate future revenue. It combines pipeline size, deal movement, stage performance, and risk signals to assess whether the pipeline can realistically support revenue targets.
What is analyzed
Pipeline value, number of deals, and pipeline coverage ratio
Movement of deals across sales pipeline stages
Speed indicators such as deal cycle and deal aging
Quality indicators such as pipeline health and lead quality
Risk signals such as slippage rate and stalled deals
How analysis is performed
Select a period and compare it to historical data
Start with overall pipeline metrics and coverage
Analyze pipeline dynamics using deal movement or waterfall views
Review stage-level conversion and duration
Identify gaps, risks, and unhealthy pipeline segments
Turn insights into actions for process, coaching, and forecasting
Key metrics used
Core metrics: win rate, average deal size, sales cycle length, pipeline coverage, stage conversion, stage duration
Advanced metrics: sales velocity, deal velocity, slippage rate, pipeline value leakage, pipeline health amount
Common pipeline gaps and risks
Deals stuck too long in one stage
Poor conversion between key stages
Repeated close-date pushouts
Low-quality or poorly qualified deals
Over-reliance on a small number of large deals
Impact on sales forecasting
By filtering out unhealthy deals and adjusting for timing risk, sales pipeline analysis improves forecast accuracy and leads to more realistic accurate revenue projections.
Tools used
CRM reports for basic visibility
BI tools for flexible analysis
Dedicated sales and revenue intelligence platforms for actionable insights
Tools like Forecastio help turn raw CRM data into a clear sales pipeline report. Instead of static dashboards, teams see risks early and act faster. This is how sales organizations move from reporting to execution.
What is a sales pipeline analysis?
Sales pipeline analysis is the practice of examining how deals progress through the sales funnel, from initial contact to closing deals. It evaluates structure, speed, quality, and outcomes across the sales process.
At its core, sales pipeline analysis measures:
The number of deals at each pipeline stage
Win rate and conversion rates
average deal size
average sales cycle length
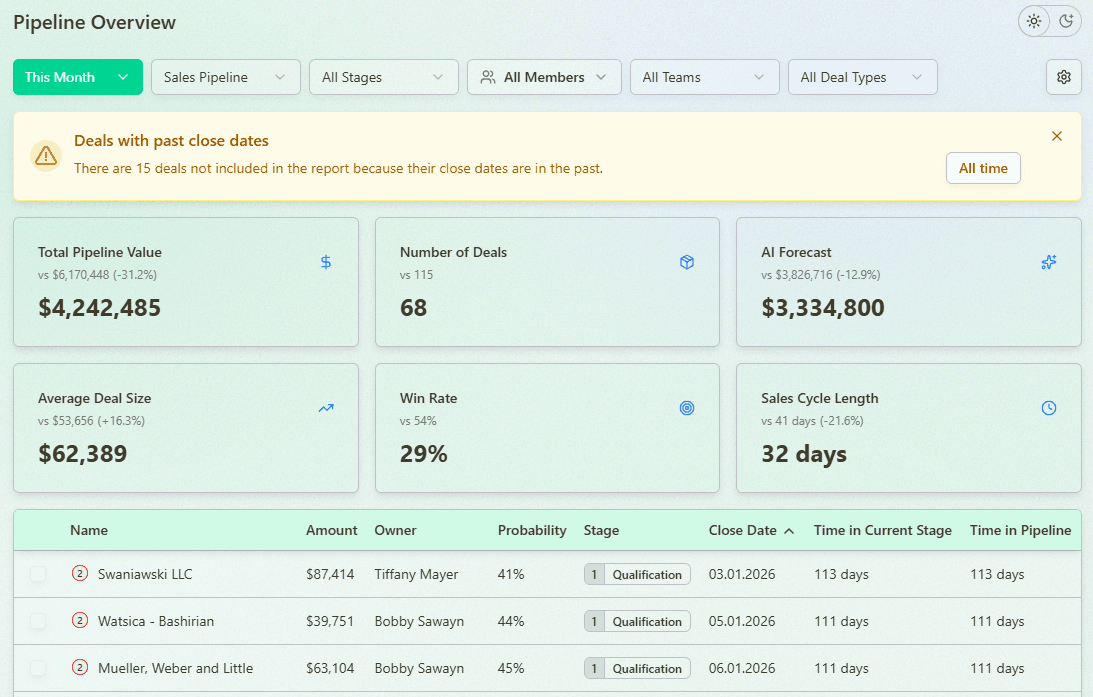
Sales Pipeline Overview and Trend Analysis with Forecastio
Unlike basic pipeline management, analysis focuses on patterns and causes. It explains why deals move forward or stall. It also shows how sales activities impact revenue generated.
Most teams analyze:
Pipeline metrics by stage
Deal aging and delays
Gaps between potential revenue and actual results
According to Gartner, poor pipeline visibility is a top reason for missed forecasts. Many companies track volume but ignore quality. This leads to unreliable sales forecasting and weak forecast accuracy.
With proper sales pipeline analysis, sales managers can identify deals that matter. Sales reps get clearer priorities. Marketing teams see if qualified leads convert into future sales.
In 2026, conducting effective sales pipeline analysis leverages AI for predictive insights.
Why is sales pipeline analysis important?
Sales pipeline analysis is important because it connects daily sales activities to revenue growth. Without it, teams operate on assumptions instead of evidence.
Visibility into pipeline risks and revenue gaps
A sales pipeline does not guarantee revenue generated. Analysis highlights:
Stalled, inactive or slipping deals
Weak pipeline stage transitions
Inflated pipeline value
This visibility helps teams spot gaps between revenue potential and reality. It prevents surprises late in the sales cycle.
Better decision-making for sales leaders and RevOps teams
For sales leaders and revenue operations, sales pipeline analysis supports decisions about where the sales process needs adjustment, not just who is performing well or poorly.
It helps teams understand:
Which sales pipeline stages create friction and slow the process
Where pipeline stage activities need review or standardization
Whether issues come from lead quality, sales activities, or process design
If sales reps struggle with specific stages rather than overall performance
Whether lead generation efforts produce qualified leads that convert later in the buyer journey
Instead of reacting in pipeline reviews by pushing reps to “close faster,” leaders use sales data to identify which pipeline stage or sales activities cause delays and adjust the sales process accordingly. This leads to more focused coaching, clearer expectations for each pipeline stage, and stronger sales performance.
Sales pipeline analysis enables continuous pipeline improvement, helping you identify and resolve issues more quickly.
What is the difference between sales pipeline analysis and pipeline management?
In short:
Pipeline management defines how the system should work
Pipeline analysis shows how the system is actually performing
Sales pipeline management is the ongoing discipline of designing, governing, and steering the sales pipeline to ensure predictable revenue growth. It defines how the sales pipeline represents the real buyer journey, how sales pipeline stages are structured, how deals should progress, and how the sales team operates inside that system.
In high-level terms, sales pipeline management includes:
Designing and maintaining the sales process and sales funnel
Defining stage criteria, exit rules, and ownership
Setting expectations for sales activities and deal progression
Running pipeline reviews and enforcing standards
Aligning marketing teams, sales reps, and revenue operations
Ensuring the pipeline supports revenue targets and sales strategy
Sales pipeline analysis, on the other hand, is the analytical layer that evaluates whether pipeline management is actually working.
Sales pipeline analysis focuses on:
pipeline health and pipeline coverage ratio
conversion rates between stages
average sales cycle
stalled deals, slippage, and leakage
The gap between pipeline value and revenue generated
Analysis uses sales data, historical data, and pipeline metrics to measure outcomes, detect risks, and explain performance.
How to perform a sales pipeline analysis (step-by-step)?
Sales pipeline analysis is performed by reviewing pipeline performance from top to bottom, starting with overall pipeline size and movement, then drilling into sales pipeline stages, risks, and deal-level signals, and finally turning insights into concrete actions. The goal is to understand whether the sales funnel can realistically deliver future revenue, and what needs to change to improve sales performance.
Step 1: Define the period and comparison baseline
Pick the period you want to analyze. For example, this month or this quarter. Then choose a comparable baseline. Use the previous month, the same quarter last year, or the previous 90 days. This helps you see trends in pipeline metrics, not just a snapshot. It also supports accurate revenue projections.
Step 2: Review overall pipeline size and coverage
Start with general sales pipeline metrics. Look at the number of deals, total pipeline value, and pipeline coverage. Compare pipeline coverage ratio to your revenue targets. This quickly shows if you have enough potential revenue to hit sales targets.
Step 3: Analyze pipeline dynamics with a waterfall view
Use a waterfall to understand what changed in the sales pipeline during the period. Track new deals added, deals slipped, deals lost, and deals won. This gives a clear visual representation of movement. It also shows whether growth comes from lead generation efforts or just deal amounts changes.
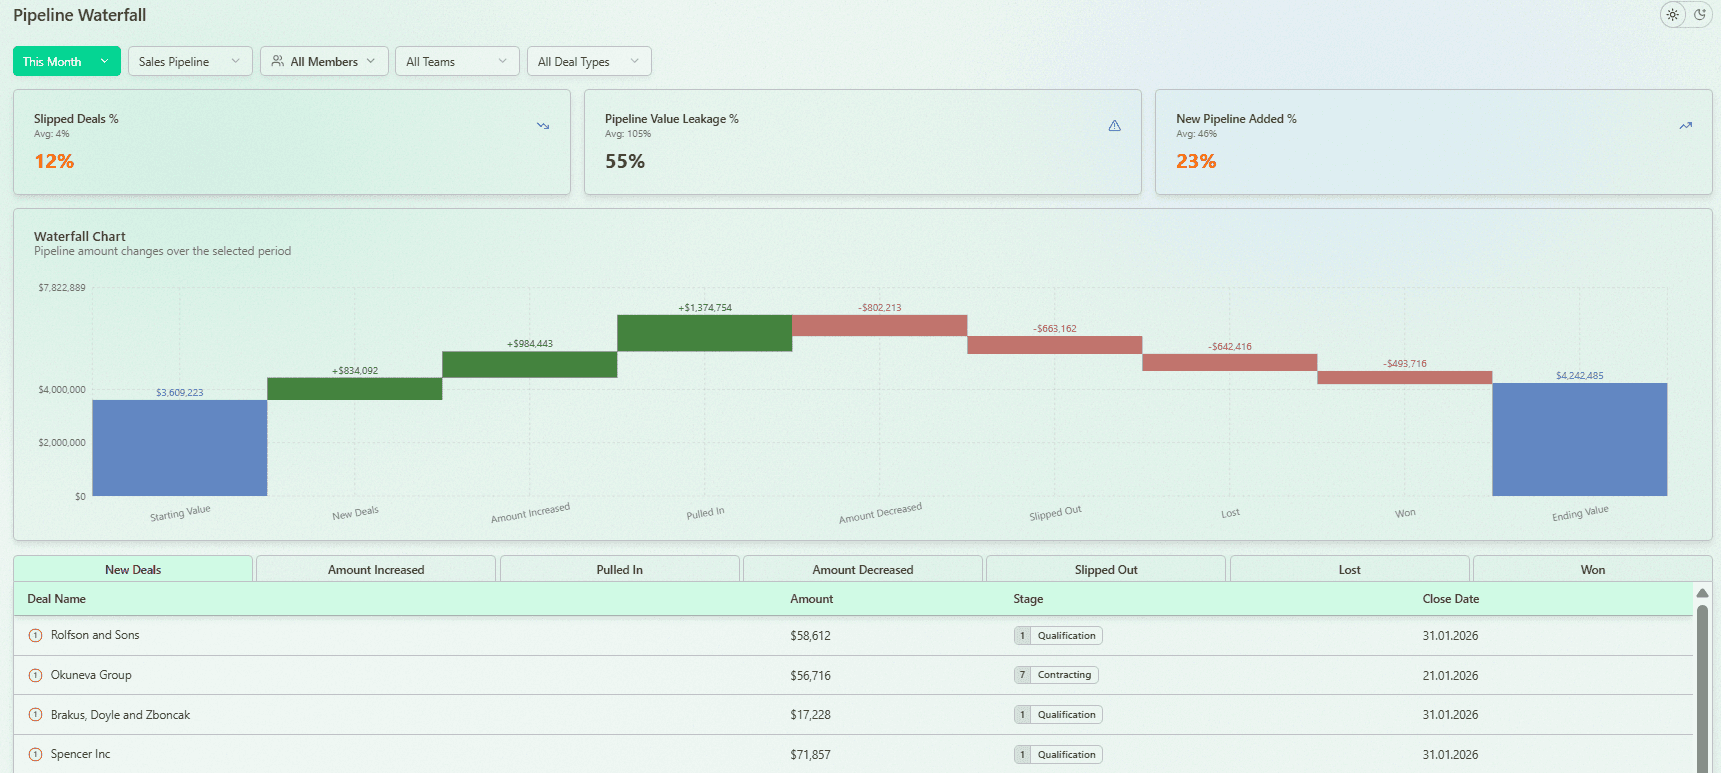
Pipeline Waterfall Analysis with Forecastio
Step 4: Move to sales pipeline stages and measure performance
Now go deeper. Review sales pipeline stages and analyze conversion rates, durations and sales pipeline stage volume. Identify weak transitions and overloaded stages. This is where many stalled deals appear. It also helps you see if a specific pipeline stage is blocking progress in the sales process.
Step 5: Check speed, aging, and leakage signals
Assess speed and quality. Add leakage signals like slippage rate and pipeline health rate. Quantify the pipeline health amount versus risky or inactive deals.
Step 6: Turn insights into actions for reps, process, and forecasting
Convert findings into actions. Decide what to fix in the sales process, how to coach sales reps, and what deals require reactivation and action plans. Then update your sales forecasting assumptions based on what is actually happening. This is how you get more accurate sales forecasts and better forecast accuracy.
Sales pipeline analysis involves tracking deals, identifying bottlenecks, and analyzing metrics to improve conversion rates and hit revenue targets. Effective sales pipeline analysis requires weekly audits to identify bottlenecks. Regular reviews of the sales pipeline are essential for maintaining its health and effectiveness.
You can also read a guide from Pipedrive on how to improve sales pipeline analysis efficiency.
Important sales pipeline metrics
Effective sales pipeline analysis relies on two groups of metrics: core and advanced. Core sales pipeline indicators help teams understand pipeline size, speed, and basic conversion across the sales pipeline. Advanced pipeline metrics go deeper and reveal momentum, risk, and hidden revenue leakage. Together, these metrics show whether the pipeline can realistically deliver future revenue and where performance starts to break down.
Core sales pipeline metrics
Core sales pipeline indicators show how large the pipeline is, how fast deals move, and how effectively they convert.
Win Rate
Measure win rate as the share of deals that close successfully out of all closed deals in a given period. Review it monthly and quarterly to track sales performance and deal quality.
Sales Cycle Length
Sales cycle length is the average number of days from initial contact to closing. Review it monthly and compare it to the average sales cycle length from past periods to spot slowdowns.
Average Deal Size
Calculate average deal size by dividing closed-won revenue by the number of deals closed. Review it monthly to understand how deal value impacts pipeline value and revenue targets.
Pipeline Coverage
Pipeline coverage measures how much total pipeline value exists compared to the revenue goal for the same period. Review it weekly or monthly using the pipeline coverage ratio to see if there is enough potential revenue. A healthy pipeline coverage ratio is typically between 3:1 to 4:1 of pipeline value to sales quota. You can read more about sales pipeline coverage in a guide prepared by HubSpot.
Pipeline Stage Conversion
This metric shows how many deals move from one pipeline stage to the next. Review it monthly to identify weak transitions inside the sales pipeline stages.
Pipeline Stage Duration
Pipeline stage duration measures how long deals stay in each sales pipeline stage. Review it monthly to detect stalled deals and process friction.
Pipeline Close Ratio
Measure pipeline close ratio as the number of closed deals (both won and lost) divided by the total number of deals that entered your sales pipeline in the same period. Review it monthly or quarterly.
Pipeline Growth Rate
This metric shows how the sales pipeline grows or shrinks over time based on total pipeline value. Review it monthly to understand whether lead generation efforts support revenue growth.
Advanced sales pipeline metrics
Advanced pipeline metrics provide deeper insight into pipeline momentum, risk exposure, and where revenue quietly slips away.
Sales Velocity
Sales velocity reflects how quickly revenue moves through the sales pipeline based on deal volume, size, and speed. Review it monthly to evaluate overall pipeline efficiency.
Deal Velocity
Deal velocity shows how fast individual deals progress through sales pipeline stages. Review it weekly to catch early signs of slowing momentum.
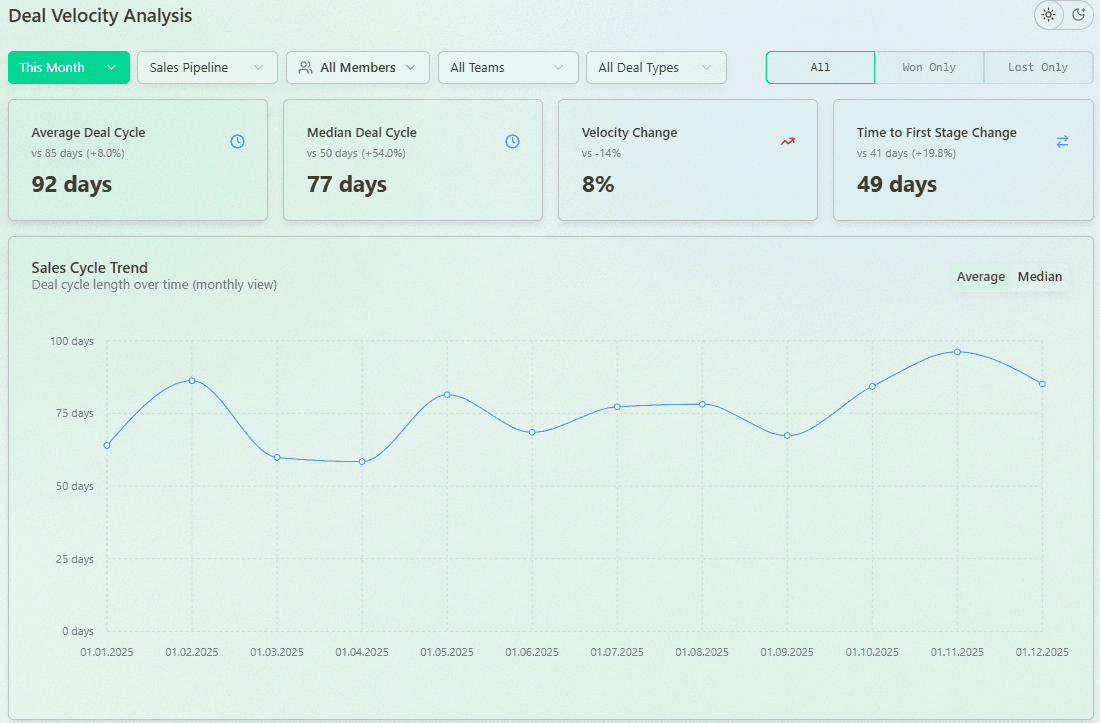
Deal Velocity Analysis with Forecastio
Slippage Rate
Slippage rate measures how often deals move their expected close date to a later period. Review it weekly or monthly, as high slippage directly impacts forecast accuracy.
Pipeline Value Leakage
Pipeline value leakage tracks how much pipeline value is lost due to dropped, delayed, or downsized deals. Review it monthly to identify where revenue potential disappears.
Pipeline Health Amount
Pipeline health amount represents the value of active, qualified deals that are progressing normally. Review it weekly to understand how much of the pipeline supports future revenue.
By analyzing your pipeline regularly, you gain critical insights into revenue potential, manage expenses, and optimize sales strategies.
How to analyze sales pipeline stages
Analyzing sales pipeline stages helps identify where deals slow down, lose quality, or fail to progress through the sales process. Stage-level analysis shows whether problems come from lead quality, unclear criteria, or ineffective sales activities, and it provides clear inputs for coaching and process improvements.
Evaluating stage conversion rates
Review how many deals move from one pipeline stage to the next over a defined period. Compare conversion rates across stages and against historical data to identify weak transitions. Low conversion usually signals poor qualification, unclear stage exit criteria, or misalignment with the buyer journey.
Analyzing stage duration and deal aging
Measure how long deals stay in each sales pipeline stage and compare it to the average sales cycle. Focus on stages where duration keeps increasing, as these often hide stalled deals. Deal aging at the stage level helps separate normal progress from deals that are unlikely to close.
Identifying weak or overloaded stages
Look for stages that accumulate a large number of deals or a disproportionate share of pipeline value. Overloaded stages often indicate that deals are being pushed forward too early or not disqualified on time. These stages usually create false confidence in the sales pipeline.
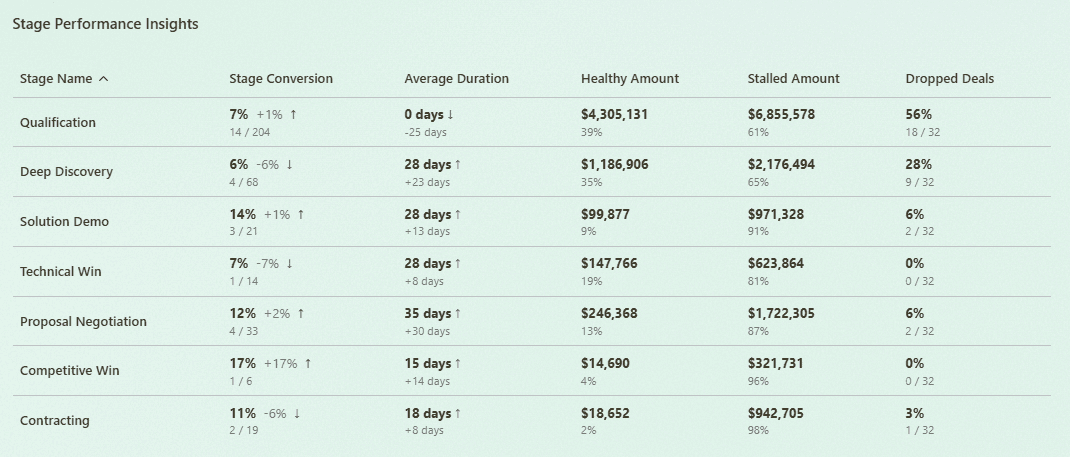
Sales Pipeline Stage Analysis with Forecastio
Using stage-level insights for coaching and process improvements
Use stage insights to identify where sales reps struggle in the sales process, rather than judging overall performance. Coaching becomes more targeted when it focuses on specific stages and activities. At the same time, stage definitions and exit criteria can be adjusted to improve overall sales performance.
According to Salesforce, roughly 20–25% of leads advance past the initial qualification stage, while about 80–90% of deals in the final negotiation stage eventually close. In other words, one-quarter or fewer of early-stage leads typically move forward, but once an opportunity reaches late-stage negotiation, the vast majority do turn into wins. These benchmarks help set realistic expectations for funnel progression at different stages.
How does sales pipeline analysis improve sales forecasting?
According to Clari, most companies miss their forecasts: 85% of B2B firms regularly miss their monthly sales forecast by more than 5%.
Sales pipeline analysis improves sales forecasting accuracy by validating whether the deals in the sales pipeline are realistic, timely, and healthy enough to convert into future revenue. Instead of relying on raw pipeline value or subjective deal confidence, teams use pipeline signals to assess risk, timing, and probability more accurately. Data-driven analysis can improve forecast accuracy by 30-40%.
Separating pipeline volume from pipeline quality
Pipeline analysis improves forecasts by distinguishing between visible pipeline value and realistic pipeline health. By reviewing stage conversion rates, deal aging, and slippage rate, teams can exclude or down-weight deals that are unlikely to close within the forecast period. This directly improves forecast accuracy and reduces last-minute surprises.
Improving close-date and timing accuracy
Stage-level pipeline analysis helps teams understand how deals move through sales pipeline stages over time. By analyzing average sales cycle length and stage duration using historical data, teams can estimate when revenue is likely to close. This leads to more reliable timelines and accurate revenue projections, especially in longer sales cycles.
Enabling continuous forecast adjustments
Because pipeline signals change during the period, sales pipeline analysis enables ongoing forecast updates. Signals such as stalled stages, declining conversion rates, or repeated close-date pushouts indicate when forecasts need correction. This allows sales leaders and revenue operations teams to adjust expectations early, instead of explaining missed revenue targets after the quarter ends.
AI Sales Forecasting with Forecastio
Platforms like Forecastio support this by linking pipeline signals directly to forecasting logic and actions.
Most common sales pipeline bottlenecks and risks
Most sales pipeline bottlenecks and risks appear when deals slow down, lose quality, or create false confidence in the sales pipeline. These issues often stay hidden if teams focus only on pipeline value instead of movement, quality, and timing. Sales pipeline analysis helps surface these risks early, before they impact future revenue and sales forecasting. Focusing on high-quality opportunities rather than inflating the pipeline with low-probability deals improves sales conversion rates.
Deals stuck too long in specific stages
Deals that remain too long in one pipeline stage usually indicate weak qualification, unclear next steps, or stalled buyer interest. These stalled deals inflate pipeline value while contributing little to revenue generated. Over time, they reduce pipeline health and distort forecasts. Stalled Deal Analysis flags deals that exceed typical stage durations for immediate intervention.
Poor stage conversion between key funnel steps
Low conversion rates between sales pipeline stages signal friction in the sales process. This often happens when stage criteria are unclear or when deals are pushed forward prematurely. As a result, the pipeline looks active but delivers fewer closing deals.
High pipeline slippage and close-date pushouts
High slippage rate occurs when deals repeatedly move their expected close date. This usually means the deal was forecast too early or the buyer timeline was misunderstood. Persistent slippage is one of the strongest indicators of weak forecast accuracy.
Low-quality or poorly qualified deals
Poor lead quality leads to deals entering the sales pipeline without real buying intent. These deals consume sales efforts and increase the number of deals without improving future sales. Over time, they lower both win rate and overall sales performance.
Over-reliance on a small number of large deals
When a large share of total pipeline value depends on a few deals, the pipeline becomes fragile. Losing one deal can significantly impact revenue targets and accurate revenue projections. Sales pipeline analysis helps expose this risk by looking beyond totals to distribution and balance.
What tools to use for sales pipeline analysis?
Sales pipeline analysis can be done using different types of sales tools, depending on how deep and actionable the analysis needs to be. Some tools focus on basic visibility, others on flexible reporting, and others on turning pipeline signals into decisions and actions.
The right choice depends on pipeline complexity, deal volume, and how critical sales forecasting and risk detection are for your sales organization. Sales pipeline tools can help prioritize high-value opportunities and streamline the sales process. Also, Sales pipeline management tools can automate reporting and ensure accuracy in sales data.
CRM-native pipeline reporting
CRM systems provide built-in reports that show the sales pipeline, deal stages, and basic pipeline metrics. These tools are useful for quick visibility into pipeline value, number of deals, and simple sales pipeline stages, especially for smaller teams.
Examples include HubSpot and Salesforce, which offer standard pipeline dashboards, stage conversion reports, and deal lists. However, CRM-native reporting often lacks deeper insights into pipeline health, slippage, and stage-level risks.
BI and analytics tools
Business intelligence tools allow teams to analyze sales data more flexibly by combining CRM data with other sources. They are useful for advanced reporting, custom charts, and historical comparisons across sales performance metrics.
Examples include Tableau, Power BI, and Looker. These tools are powerful but often require technical setup, data modeling, and ongoing maintenance, which slows down decision-making for sales leaders and RevOps teams.
Dedicated sales and revenue intelligence platforms
Dedicated platforms are built specifically for sales pipeline analysis, sales forecasting, and pipeline risk detection. They go beyond reporting and use AI to uncover issues, trends, and actions across sales pipeline stages. AI-powered tools enhance sales pipeline analysis by identifying patterns and providing real-time alerts.
Examples include Forecastio, Clari, BoostUp, InsightSquared, and Gong. These platforms help teams detect stalled deals, pipeline slippage, and unhealthy pipeline segments, and connect pipeline insights directly to forecast accuracy and execution. Sales pipeline management tools can automate reporting and ensure accuracy in sales data.
How Forecastio helps analyze sales pipeline and prevent revenue leakage?
Forecastio helps teams move from passive sales pipeline analysis to continuous pipeline control by turning sales data into clear, actionable signals. Instead of reviewing dozens of reports, sales leaders and revenue operations teams immediately see where revenue potential is at risk and why.
Forecastio analyzes sales pipeline stages, deal movement, pipeline health, and historical behavior to surface stalled deals, rising slippage rate, unhealthy segments of the pipeline, and gaps between pipeline value and realistic future revenue. These insights help teams understand not only what is happening in the pipeline, but where the sales process breaks down.
By connecting pipeline signals directly to sales forecasting, Forecastio helps teams improve forecast accuracy, adjust expectations earlier, and take corrective action before missed revenue targets appear. This makes pipeline analysis a daily decision-making tool rather than a retrospective sales pipeline report.
FAQ
How to analyse a sales pipeline?
To analyse a sales pipeline, start by selecting a time period and comparing it to similar historical data. Review overall pipeline metrics like pipeline value and coverage, then move to sales pipeline stages to analyze conversion rates, stage duration, slippage, and stalled deals. Finish by identifying gaps and turning insights into concrete actions.
What are the 5 stages of the sales pipeline?
The five common sales pipeline stages are lead qualification, initial contact or discovery, proposal, negotiation, and closing. The exact names may vary, but each stage should represent a clear step in the buyer journey and have defined entry and exit criteria. Well-defined stages are critical for accurate sales pipeline analysis.
How to measure the sales pipeline?
You measure a sales pipeline by tracking key metrics such as pipeline value, number of deals, pipeline coverage, conversion rates, sales cycle length, and pipeline health. These metrics show both the size and quality of the pipeline and help assess whether it can realistically deliver future revenue.
What is the 3-3-3 rule in sales?
The 3-3-3 rule is a sales activity framework often used in prospecting. It suggests spending 3 minutes researching a prospect, 3 minutes personalizing outreach, and 3 minutes preparing a clear next step. While not a pipeline metric, it supports better lead quality at the top of the sales pipeline.
Sales Pipeline Analysis: Summary
Sales pipeline analysis is the evaluation of how deals move through the sales pipeline, how healthy those deals are, and how likely they are to generate future revenue. It combines pipeline size, deal movement, stage performance, and risk signals to assess whether the pipeline can realistically support revenue targets.
What is analyzed
Pipeline value, number of deals, and pipeline coverage ratio
Movement of deals across sales pipeline stages
Speed indicators such as deal cycle and deal aging
Quality indicators such as pipeline health and lead quality
Risk signals such as slippage rate and stalled deals
How analysis is performed
Select a period and compare it to historical data
Start with overall pipeline metrics and coverage
Analyze pipeline dynamics using deal movement or waterfall views
Review stage-level conversion and duration
Identify gaps, risks, and unhealthy pipeline segments
Turn insights into actions for process, coaching, and forecasting
Key metrics used
Core metrics: win rate, average deal size, sales cycle length, pipeline coverage, stage conversion, stage duration
Advanced metrics: sales velocity, deal velocity, slippage rate, pipeline value leakage, pipeline health amount
Common pipeline gaps and risks
Deals stuck too long in one stage
Poor conversion between key stages
Repeated close-date pushouts
Low-quality or poorly qualified deals
Over-reliance on a small number of large deals
Impact on sales forecasting
By filtering out unhealthy deals and adjusting for timing risk, sales pipeline analysis improves forecast accuracy and leads to more realistic accurate revenue projections.
Tools used
CRM reports for basic visibility
BI tools for flexible analysis
Dedicated sales and revenue intelligence platforms for actionable insights
Tools like Forecastio help turn raw CRM data into a clear sales pipeline report. Instead of static dashboards, teams see risks early and act faster. This is how sales organizations move from reporting to execution.
What is a sales pipeline analysis?
Sales pipeline analysis is the practice of examining how deals progress through the sales funnel, from initial contact to closing deals. It evaluates structure, speed, quality, and outcomes across the sales process.
At its core, sales pipeline analysis measures:
The number of deals at each pipeline stage
Win rate and conversion rates
average deal size
average sales cycle length
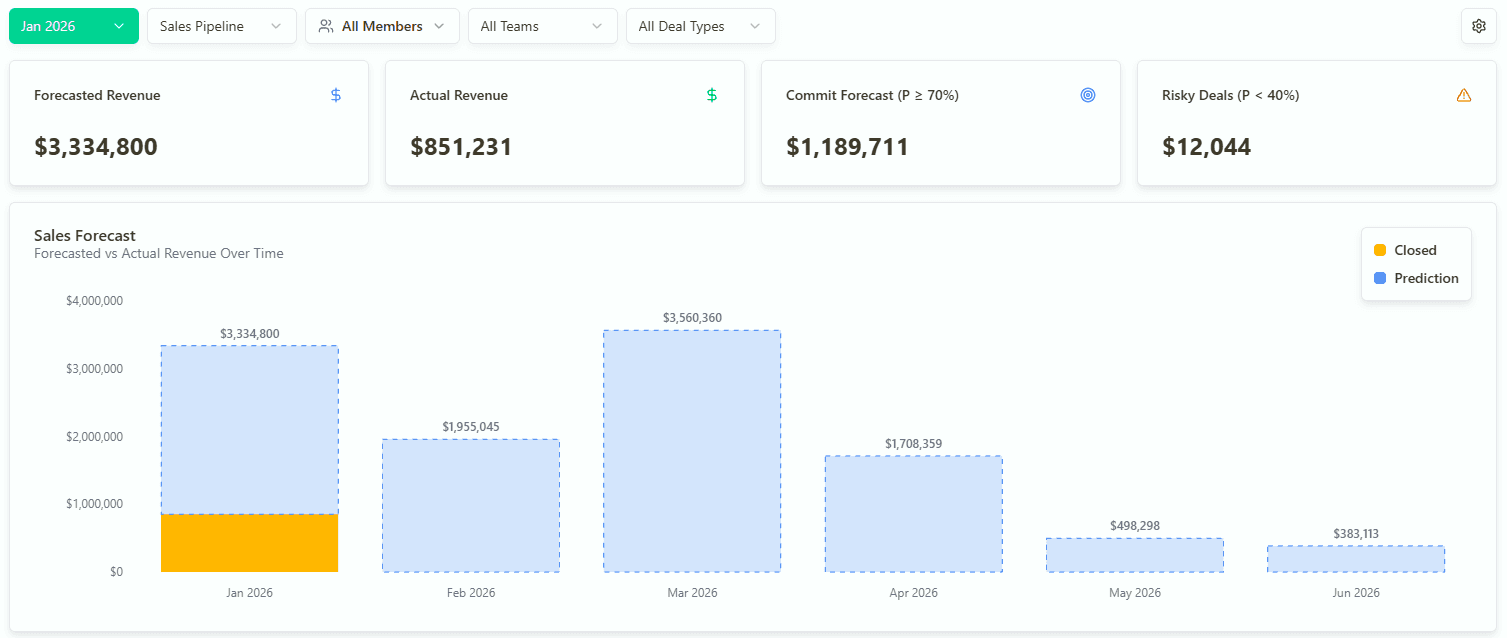
Sales Pipeline Overview and Trend Analysis with Forecastio
Unlike basic pipeline management, analysis focuses on patterns and causes. It explains why deals move forward or stall. It also shows how sales activities impact revenue generated.
Most teams analyze:
Pipeline metrics by stage
Deal aging and delays
Gaps between potential revenue and actual results
According to Gartner, poor pipeline visibility is a top reason for missed forecasts. Many companies track volume but ignore quality. This leads to unreliable sales forecasting and weak forecast accuracy.
With proper sales pipeline analysis, sales managers can identify deals that matter. Sales reps get clearer priorities. Marketing teams see if qualified leads convert into future sales.
In 2026, conducting effective sales pipeline analysis leverages AI for predictive insights.
Why is sales pipeline analysis important?
Sales pipeline analysis is important because it connects daily sales activities to revenue growth. Without it, teams operate on assumptions instead of evidence.
Visibility into pipeline risks and revenue gaps
A sales pipeline does not guarantee revenue generated. Analysis highlights:
Stalled, inactive or slipping deals
Weak pipeline stage transitions
Inflated pipeline value
This visibility helps teams spot gaps between revenue potential and reality. It prevents surprises late in the sales cycle.
Better decision-making for sales leaders and RevOps teams
For sales leaders and revenue operations, sales pipeline analysis supports decisions about where the sales process needs adjustment, not just who is performing well or poorly.
It helps teams understand:
Which sales pipeline stages create friction and slow the process
Where pipeline stage activities need review or standardization
Whether issues come from lead quality, sales activities, or process design
If sales reps struggle with specific stages rather than overall performance
Whether lead generation efforts produce qualified leads that convert later in the buyer journey
Instead of reacting in pipeline reviews by pushing reps to “close faster,” leaders use sales data to identify which pipeline stage or sales activities cause delays and adjust the sales process accordingly. This leads to more focused coaching, clearer expectations for each pipeline stage, and stronger sales performance.
Sales pipeline analysis enables continuous pipeline improvement, helping you identify and resolve issues more quickly.
What is the difference between sales pipeline analysis and pipeline management?
In short:
Pipeline management defines how the system should work
Pipeline analysis shows how the system is actually performing
Sales pipeline management is the ongoing discipline of designing, governing, and steering the sales pipeline to ensure predictable revenue growth. It defines how the sales pipeline represents the real buyer journey, how sales pipeline stages are structured, how deals should progress, and how the sales team operates inside that system.
In high-level terms, sales pipeline management includes:
Designing and maintaining the sales process and sales funnel
Defining stage criteria, exit rules, and ownership
Setting expectations for sales activities and deal progression
Running pipeline reviews and enforcing standards
Aligning marketing teams, sales reps, and revenue operations
Ensuring the pipeline supports revenue targets and sales strategy
Sales pipeline analysis, on the other hand, is the analytical layer that evaluates whether pipeline management is actually working.
Sales pipeline analysis focuses on:
pipeline health and pipeline coverage ratio
conversion rates between stages
average sales cycle
stalled deals, slippage, and leakage
The gap between pipeline value and revenue generated
Analysis uses sales data, historical data, and pipeline metrics to measure outcomes, detect risks, and explain performance.
How to perform a sales pipeline analysis (step-by-step)?
Sales pipeline analysis is performed by reviewing pipeline performance from top to bottom, starting with overall pipeline size and movement, then drilling into sales pipeline stages, risks, and deal-level signals, and finally turning insights into concrete actions. The goal is to understand whether the sales funnel can realistically deliver future revenue, and what needs to change to improve sales performance.
Step 1: Define the period and comparison baseline
Pick the period you want to analyze. For example, this month or this quarter. Then choose a comparable baseline. Use the previous month, the same quarter last year, or the previous 90 days. This helps you see trends in pipeline metrics, not just a snapshot. It also supports accurate revenue projections.
Step 2: Review overall pipeline size and coverage
Start with general sales pipeline metrics. Look at the number of deals, total pipeline value, and pipeline coverage. Compare pipeline coverage ratio to your revenue targets. This quickly shows if you have enough potential revenue to hit sales targets.
Step 3: Analyze pipeline dynamics with a waterfall view
Use a waterfall to understand what changed in the sales pipeline during the period. Track new deals added, deals slipped, deals lost, and deals won. This gives a clear visual representation of movement. It also shows whether growth comes from lead generation efforts or just deal amounts changes.
Pipeline Waterfall Analysis with Forecastio
Step 4: Move to sales pipeline stages and measure performance
Now go deeper. Review sales pipeline stages and analyze conversion rates, durations and sales pipeline stage volume. Identify weak transitions and overloaded stages. This is where many stalled deals appear. It also helps you see if a specific pipeline stage is blocking progress in the sales process.
Step 5: Check speed, aging, and leakage signals
Assess speed and quality. Add leakage signals like slippage rate and pipeline health rate. Quantify the pipeline health amount versus risky or inactive deals.
Step 6: Turn insights into actions for reps, process, and forecasting
Convert findings into actions. Decide what to fix in the sales process, how to coach sales reps, and what deals require reactivation and action plans. Then update your sales forecasting assumptions based on what is actually happening. This is how you get more accurate sales forecasts and better forecast accuracy.
Sales pipeline analysis involves tracking deals, identifying bottlenecks, and analyzing metrics to improve conversion rates and hit revenue targets. Effective sales pipeline analysis requires weekly audits to identify bottlenecks. Regular reviews of the sales pipeline are essential for maintaining its health and effectiveness.
You can also read a guide from Pipedrive on how to improve sales pipeline analysis efficiency.
Important sales pipeline metrics
Effective sales pipeline analysis relies on two groups of metrics: core and advanced. Core sales pipeline indicators help teams understand pipeline size, speed, and basic conversion across the sales pipeline. Advanced pipeline metrics go deeper and reveal momentum, risk, and hidden revenue leakage. Together, these metrics show whether the pipeline can realistically deliver future revenue and where performance starts to break down.
Core sales pipeline metrics
Core sales pipeline indicators show how large the pipeline is, how fast deals move, and how effectively they convert.
Win Rate
Measure win rate as the share of deals that close successfully out of all closed deals in a given period. Review it monthly and quarterly to track sales performance and deal quality.
Sales Cycle Length
Sales cycle length is the average number of days from initial contact to closing. Review it monthly and compare it to the average sales cycle length from past periods to spot slowdowns.
Average Deal Size
Calculate average deal size by dividing closed-won revenue by the number of deals closed. Review it monthly to understand how deal value impacts pipeline value and revenue targets.
Pipeline Coverage
Pipeline coverage measures how much total pipeline value exists compared to the revenue goal for the same period. Review it weekly or monthly using the pipeline coverage ratio to see if there is enough potential revenue. A healthy pipeline coverage ratio is typically between 3:1 to 4:1 of pipeline value to sales quota. You can read more about sales pipeline coverage in a guide prepared by HubSpot.
Pipeline Stage Conversion
This metric shows how many deals move from one pipeline stage to the next. Review it monthly to identify weak transitions inside the sales pipeline stages.
Pipeline Stage Duration
Pipeline stage duration measures how long deals stay in each sales pipeline stage. Review it monthly to detect stalled deals and process friction.
Pipeline Close Ratio
Measure pipeline close ratio as the number of closed deals (both won and lost) divided by the total number of deals that entered your sales pipeline in the same period. Review it monthly or quarterly.
Pipeline Growth Rate
This metric shows how the sales pipeline grows or shrinks over time based on total pipeline value. Review it monthly to understand whether lead generation efforts support revenue growth.
Advanced sales pipeline metrics
Advanced pipeline metrics provide deeper insight into pipeline momentum, risk exposure, and where revenue quietly slips away.
Sales Velocity
Sales velocity reflects how quickly revenue moves through the sales pipeline based on deal volume, size, and speed. Review it monthly to evaluate overall pipeline efficiency.
Deal Velocity
Deal velocity shows how fast individual deals progress through sales pipeline stages. Review it weekly to catch early signs of slowing momentum.
Deal Velocity Analysis with Forecastio
Slippage Rate
Slippage rate measures how often deals move their expected close date to a later period. Review it weekly or monthly, as high slippage directly impacts forecast accuracy.
Pipeline Value Leakage
Pipeline value leakage tracks how much pipeline value is lost due to dropped, delayed, or downsized deals. Review it monthly to identify where revenue potential disappears.
Pipeline Health Amount
Pipeline health amount represents the value of active, qualified deals that are progressing normally. Review it weekly to understand how much of the pipeline supports future revenue.
By analyzing your pipeline regularly, you gain critical insights into revenue potential, manage expenses, and optimize sales strategies.
How to analyze sales pipeline stages
Analyzing sales pipeline stages helps identify where deals slow down, lose quality, or fail to progress through the sales process. Stage-level analysis shows whether problems come from lead quality, unclear criteria, or ineffective sales activities, and it provides clear inputs for coaching and process improvements.
Evaluating stage conversion rates
Review how many deals move from one pipeline stage to the next over a defined period. Compare conversion rates across stages and against historical data to identify weak transitions. Low conversion usually signals poor qualification, unclear stage exit criteria, or misalignment with the buyer journey.
Analyzing stage duration and deal aging
Measure how long deals stay in each sales pipeline stage and compare it to the average sales cycle. Focus on stages where duration keeps increasing, as these often hide stalled deals. Deal aging at the stage level helps separate normal progress from deals that are unlikely to close.
Identifying weak or overloaded stages
Look for stages that accumulate a large number of deals or a disproportionate share of pipeline value. Overloaded stages often indicate that deals are being pushed forward too early or not disqualified on time. These stages usually create false confidence in the sales pipeline.
How to analyze sales pipeline stages
Analyzing sales pipeline stages helps identify where deals slow down, lose quality, or fail to progress through the sales process. Stage-level analysis shows whether problems come from lead quality, unclear criteria, or ineffective sales activities, and it provides clear inputs for coaching and process improvements.
Evaluating stage conversion rates
Review how many deals move from one pipeline stage to the next over a defined period. Compare conversion rates across stages and against historical data to identify weak transitions. Low conversion usually signals poor qualification, unclear stage exit criteria, or misalignment with the buyer journey.
Analyzing stage duration and deal aging
Measure how long deals stay in each sales pipeline stage and compare it to the average sales cycle. Focus on stages where duration keeps increasing, as these often hide stalled deals. Deal aging at the stage level helps separate normal progress from deals that are unlikely to close.
Identifying weak or overloaded stages
Look for stages that accumulate a large number of deals or a disproportionate share of pipeline value. Overloaded stages often indicate that deals are being pushed forward too early or not disqualified on time. These stages usually create false confidence in the sales pipeline.
Sales Pipeline Stage Analysis with Forecastio
Using stage-level insights for coaching and process improvements
Use stage insights to identify where sales reps struggle in the sales process, rather than judging overall performance. Coaching becomes more targeted when it focuses on specific stages and activities. At the same time, stage definitions and exit criteria can be adjusted to improve overall sales performance.
According to Salesforce, roughly 20–25% of leads advance past the initial qualification stage, while about 80–90% of deals in the final negotiation stage eventually close. In other words, one-quarter or fewer of early-stage leads typically move forward, but once an opportunity reaches late-stage negotiation, the vast majority do turn into wins. These benchmarks help set realistic expectations for funnel progression at different stages.
How does sales pipeline analysis improve sales forecasting?
According to Clari, most companies miss their forecasts: 85% of B2B firms regularly miss their monthly sales forecast by more than 5%.
Sales pipeline analysis improves sales forecasting accuracy by validating whether the deals in the sales pipeline are realistic, timely, and healthy enough to convert into future revenue. Instead of relying on raw pipeline value or subjective deal confidence, teams use pipeline signals to assess risk, timing, and probability more accurately. Data-driven analysis can improve forecast accuracy by 30-40%.
Separating pipeline volume from pipeline quality
Pipeline analysis improves forecasts by distinguishing between visible pipeline value and realistic pipeline health. By reviewing stage conversion rates, deal aging, and slippage rate, teams can exclude or down-weight deals that are unlikely to close within the forecast period. This directly improves forecast accuracy and reduces last-minute surprises.
Improving close-date and timing accuracy
Stage-level pipeline analysis helps teams understand how deals move through sales pipeline stages over time. By analyzing average sales cycle length and stage duration using historical data, teams can estimate when revenue is likely to close. This leads to more reliable timelines and accurate revenue projections, especially in longer sales cycles.
Enabling continuous forecast adjustments
Because pipeline signals change during the period, sales pipeline analysis enables ongoing forecast updates. Signals such as stalled stages, declining conversion rates, or repeated close-date pushouts indicate when forecasts need correction. This allows sales leaders and revenue operations teams to adjust expectations early, instead of explaining missed revenue targets after the quarter ends.
AI Sales Forecasting with Forecastio
Platforms like Forecastio support this by linking pipeline signals directly to forecasting logic and actions.
Most common sales pipeline bottlenecks and risks
Most sales pipeline bottlenecks and risks appear when deals slow down, lose quality, or create false confidence in the sales pipeline. These issues often stay hidden if teams focus only on pipeline value instead of movement, quality, and timing. Sales pipeline analysis helps surface these risks early, before they impact future revenue and sales forecasting. Focusing on high-quality opportunities rather than inflating the pipeline with low-probability deals improves sales conversion rates.
Deals stuck too long in specific stages
Deals that remain too long in one pipeline stage usually indicate weak qualification, unclear next steps, or stalled buyer interest. These stalled deals inflate pipeline value while contributing little to revenue generated. Over time, they reduce pipeline health and distort forecasts. Stalled Deal Analysis flags deals that exceed typical stage durations for immediate intervention.
Poor stage conversion between key funnel steps
Low conversion rates between sales pipeline stages signal friction in the sales process. This often happens when stage criteria are unclear or when deals are pushed forward prematurely. As a result, the pipeline looks active but delivers fewer closing deals.
High pipeline slippage and close-date pushouts
High slippage rate occurs when deals repeatedly move their expected close date. This usually means the deal was forecast too early or the buyer timeline was misunderstood. Persistent slippage is one of the strongest indicators of weak forecast accuracy.
Low-quality or poorly qualified deals
Poor lead quality leads to deals entering the sales pipeline without real buying intent. These deals consume sales efforts and increase the number of deals without improving future sales. Over time, they lower both win rate and overall sales performance.
Over-reliance on a small number of large deals
When a large share of total pipeline value depends on a few deals, the pipeline becomes fragile. Losing one deal can significantly impact revenue targets and accurate revenue projections. Sales pipeline analysis helps expose this risk by looking beyond totals to distribution and balance.
What tools to use for sales pipeline analysis?
Sales pipeline analysis can be done using different types of sales tools, depending on how deep and actionable the analysis needs to be. Some tools focus on basic visibility, others on flexible reporting, and others on turning pipeline signals into decisions and actions.
The right choice depends on pipeline complexity, deal volume, and how critical sales forecasting and risk detection are for your sales organization. Sales pipeline tools can help prioritize high-value opportunities and streamline the sales process. Also, Sales pipeline management tools can automate reporting and ensure accuracy in sales data.
CRM-native pipeline reporting
CRM systems provide built-in reports that show the sales pipeline, deal stages, and basic pipeline metrics. These tools are useful for quick visibility into pipeline value, number of deals, and simple sales pipeline stages, especially for smaller teams.
Examples include HubSpot and Salesforce, which offer standard pipeline dashboards, stage conversion reports, and deal lists. However, CRM-native reporting often lacks deeper insights into pipeline health, slippage, and stage-level risks.
BI and analytics tools
Business intelligence tools allow teams to analyze sales data more flexibly by combining CRM data with other sources. They are useful for advanced reporting, custom charts, and historical comparisons across sales performance metrics.
Examples include Tableau, Power BI, and Looker. These tools are powerful but often require technical setup, data modeling, and ongoing maintenance, which slows down decision-making for sales leaders and RevOps teams.
Dedicated sales and revenue intelligence platforms
Dedicated platforms are built specifically for sales pipeline analysis, sales forecasting, and pipeline risk detection. They go beyond reporting and use AI to uncover issues, trends, and actions across sales pipeline stages. AI-powered tools enhance sales pipeline analysis by identifying patterns and providing real-time alerts.
Examples include Forecastio, Clari, BoostUp, InsightSquared, and Gong. These platforms help teams detect stalled deals, pipeline slippage, and unhealthy pipeline segments, and connect pipeline insights directly to forecast accuracy and execution. Sales pipeline management tools can automate reporting and ensure accuracy in sales data.
How Forecastio helps analyze sales pipeline and prevent revenue leakage?
Forecastio helps teams move from passive sales pipeline analysis to continuous pipeline control by turning sales data into clear, actionable signals. Instead of reviewing dozens of reports, sales leaders and revenue operations teams immediately see where revenue potential is at risk and why.
Forecastio analyzes sales pipeline stages, deal movement, pipeline health, and historical behavior to surface stalled deals, rising slippage rate, unhealthy segments of the pipeline, and gaps between pipeline value and realistic future revenue. These insights help teams understand not only what is happening in the pipeline, but where the sales process breaks down.
By connecting pipeline signals directly to sales forecasting, Forecastio helps teams improve forecast accuracy, adjust expectations earlier, and take corrective action before missed revenue targets appear. This makes pipeline analysis a daily decision-making tool rather than a retrospective sales pipeline report.
FAQ
How to analyse a sales pipeline?
To analyse a sales pipeline, start by selecting a time period and comparing it to similar historical data. Review overall pipeline metrics like pipeline value and coverage, then move to sales pipeline stages to analyze conversion rates, stage duration, slippage, and stalled deals. Finish by identifying gaps and turning insights into concrete actions.
What are the 5 stages of the sales pipeline?
The five common sales pipeline stages are lead qualification, initial contact or discovery, proposal, negotiation, and closing. The exact names may vary, but each stage should represent a clear step in the buyer journey and have defined entry and exit criteria. Well-defined stages are critical for accurate sales pipeline analysis.
How to measure the sales pipeline?
You measure a sales pipeline by tracking key metrics such as pipeline value, number of deals, pipeline coverage, conversion rates, sales cycle length, and pipeline health. These metrics show both the size and quality of the pipeline and help assess whether it can realistically deliver future revenue.
What is the 3-3-3 rule in sales?
The 3-3-3 rule is a sales activity framework often used in prospecting. It suggests spending 3 minutes researching a prospect, 3 minutes personalizing outreach, and 3 minutes preparing a clear next step. While not a pipeline metric, it supports better lead quality at the top of the sales pipeline.
Share:
Alex is the CEO at Forecastio, bringing over 20 years of experience as a seasoned B2B sales expert and leader in the tech industry. His expertise lies in streamlining sales operations, developing robust go-to-market strategies, enhancing sales planning and forecasting, and refining sales processes.
Alex is the CEO at Forecastio, bringing over 20 years of experience as a seasoned B2B sales expert and leader in the tech industry. His expertise lies in streamlining sales operations, developing robust go-to-market strategies, enhancing sales planning and forecasting, and refining sales processes.
Related articles

Sales Forecasting
Dec 29, 2025
17 min
Revenue Operations
Dec 11, 2025
13 min

Sales Performance
Nov 5, 2025
7 min
Sales Forecasting
Dec 29, 2025
17 min
Revenue Operations
Dec 11, 2025
13 min
Sales Forecasting
Dec 29, 2025
17 min
Revenue Operations
Dec 11, 2025
13 min
Sales Planning
Sales Forecasting
Sales Performance Insights
Sales Planning
Sales Forecasting
Sales Performance Insights
Sales Planning
Sales Forecasting
Sales Performance Insights


Product
© 2025 Forecastio, All rights reserved.
Sales Planning
Sales Forecasting
Sales Performance Insights
Sales Planning
Sales Forecasting
Sales Performance Insights
Sales Planning
Sales Forecasting
Sales Performance Insights
Product
© 2025 Forecastio, All rights reserved.
Sales Planning
Sales Forecasting
Sales Performance Insights
Sales Planning
Sales Forecasting
Sales Performance Insights
Sales Planning
Sales Forecasting
Sales Performance Insights
Product
© 2025 Forecastio, All rights reserved.