
25 Revenue Operations Metrics + 10 Advanced Ones Every Team Should Track

Alex Zlotko
CEO at Forecastio
Last updated
Reading time
14 min
Share:
Share
Achieve 95% accuracy in HubSpot forecasting

What Are Revenue Operations Metrics?
Revenue operations metrics are measurable indicators that track how effectively a company generates, converts, and retains revenue. They provide a unified view across marketing, sales, and customer success, instead of looking at each team separately. This helps companies understand the full revenue flow and improve decision-making.
Definition of RevOps metrics
RevOps metrics are key metrics used to measure performance across the entire revenue journey, from customer acquisition to retention and expansion. They focus on outcomes, not just activity.
These metrics include areas such as:
Pipeline performance
Conversion rates
Retention and expansion
Overall revenue growth
Unlike isolated sales metrics or marketing metrics, they reflect how the whole system works together.
How RevOps metrics connect marketing, sales, and customer success
Revenue is generated through combined sales and marketing efforts and ongoing customer success efforts. RevOps metrics connect these stages into one continuous process.
For example:
Marketing brings in qualified leads
The sales team converts them into customers
Customer success focuses on retaining customers and driving expansion revenue
By tracking shared metrics across this flow, companies improve alignment and gain better visibility into the sales funnel.
RevOps metrics vs traditional departmental metrics
Traditional metrics focus on individual teams. RevOps metrics focus on the entire revenue system.
For example:
Marketing tracks cost per lead
Sales tracks win rate
RevOps tracks metrics like customer lifetime value (CLV) or net revenue retention
The difference is that revenue operations metrics show how all activities contribute to total revenue. This makes them more useful for strategic decisions and long-term revenue growth.
Why Revenue Operations Metrics Matter
Revenue operations metrics help companies understand how revenue is generated, where it is lost, and how to improve performance across the funnel. They connect marketing, sales, and customer success into one system and make revenue more predictable. Without them, teams rely on assumptions instead of data, which slows down business growth.
They align marketing, sales, and customer success into one revenue system
One of the main reasons revenue operations metrics matter is alignment. In many companies, marketing and sales teams and customer success work separately, each tracking their own numbers.
A unified approach connects the full sales funnel, from lead generation to closing deals and retaining customers. It ensures all teams focus on shared outcomes instead of isolated targets. This improves collaboration and gives better visibility into how revenue is actually generated.
They reveal what actually drives revenue (and what doesn’t)
Many teams track activity, but not outcomes. They focus on pipeline size or lead volume, but these don’t always translate into revenue growth.
The right revenue metrics highlight what truly matters, such as conversion rates, deal progression, and retention. For example, a large sales pipeline is not useful if deals don’t convert. These insights help teams identify weak points in the sales process and focus on what actually drives results.
They improve forecasting accuracy and predictability
Forecasting becomes more reliable when it is based on data instead of opinion. Revops metrics improve sales forecasting by tracking pipeline coverage, conversion rates, and deal movement.
According to Gartner, fewer than half of sales leaders fully trust their forecasts. This often comes from poor visibility into pipeline quality. When teams rely on structured metrics, they can build more accurate forecasts and achieve more predictable revenue.
They help improve efficiency and reduce revenue leakage
Revenue is often lost due to inefficiencies in the sales operations and marketing operations. Deals may stall, slip, or fail to close due to poor qualification or inconsistent execution.
Revenue operations metrics help identify where revenue is lost and how effective sales and marketing expenses are. This allows teams to improve efficiency and optimize their workflows.
They enable sustainable and scalable business growth
Strong RevOps metrics support long-term sustainable growth by improving both acquisition and retention. They help increase customer lifetime value and strengthen relationships with the existing customer base.
Over time, this leads to more stable performance and better planning. Companies can scale their revenue operations while maintaining consistency and control.
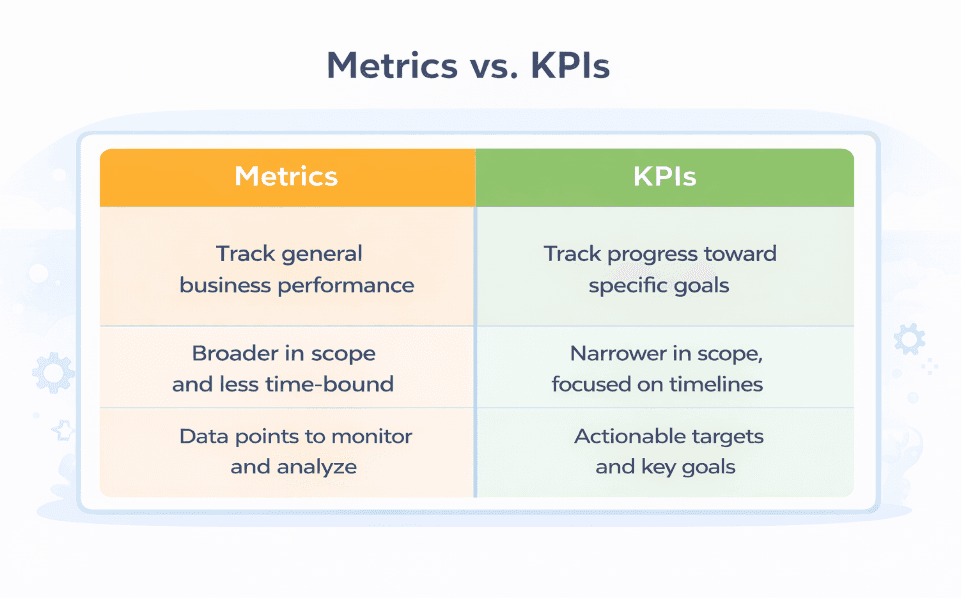
Revenue Operations Metrics vs KPIs: What's the Difference?
Revenue operations metrics and key performance indicators are closely related, but they serve different purposes. Metrics track what is happening in your business. KPIs define what success looks like based on your business goals.
RevOps metrics are the building blocks. They measure performance across the sales funnel, including conversion rates, pipeline value, and retention. These metrics help teams understand how their revenue processes are working on a daily basis.
Revenue operations KPIs, on the other hand, are selected metrics that are tied to outcomes. They are used to evaluate whether the company is hitting its revenue goals and driving revenue growth.
Here is a simple way to think about it:
A metric is something you track
A KPI is something you aim to achieve
Example:
Metric: sales cycle length = 45 days
KPI: reduce average sales cycle length to 35 days
Another example:
Metric: customer acquisition cost = $2,000
KPI: reduce CAC to $1,500 while maintaining growth
The problem is that many teams treat all metrics as equally important. This leads to overload and lack of focus. Instead of tracking everything, companies should define a small set of revenue operations kpis that directly impact total revenue and efficiency.
In practice, strong revenue operations uses both:
Metrics to monitor performance
KPIs to drive decisions
This balance helps teams stay focused, improve sales performance, and build more predictable results.
Types of Revenue Operations Metrics
RevOps metrics can be grouped into three main types: strategic, tactical, and operational. Each type reflects a different level of decision-making and covers the full journey across marketing, sales, and customer success. Together, they provide a complete view of how revenue is generated and scaled.
Strategic metrics (growth & revenue health)
Strategic metrics focus on long-term performance and overall revenue growth. They show whether the business is achieving its business goals and building a stable revenue model.
These metrics include:
Annual recurring revenue and monthly recurring revenue
Net revenue retention
Customer lifetime value
They reflect how well the company acquires, retains, and expands its existing customer base. Strategic metrics are used by leadership to guide planning, investment decisions, and long-term revenue strategy.
Tactical metrics (pipeline, conversion, and retention performance)
Tactical metrics focus on how efficiently revenue is generated across the funnel. They cover marketing conversion, sales execution, and customer retention.
Examples include:
Lead-to-opportunity conversion from marketing
Win rate and sales velocity in the sales pipeline
Retention and expansion from customer success efforts
These metrics help teams understand where deals slow down, where conversions drop, and how well customers are retained. They are essential for improving the sales process, optimizing the funnel, and supporting accurate sales forecasting.
Operational metrics (execution across teams)
Operational metrics track day-to-day execution across marketing, sales and customer success teams. They show how consistently teams perform the activities that drive results.
Examples include:
Campaign performance and lead response time in marketing
Calls, meetings, and follow-ups in sales
Onboarding progress and engagement in customer success
These operations metrics are useful for managing execution, but they should always be connected to outcomes. On their own, they don’t drive total revenue, but they influence how effectively the system performs.
25 Key Revenue Operations Metrics Every Team Should Track
RevOps metrics help companies understand how revenue is generated, how efficiently teams operate, and where improvements are needed. Below are the most important metrics across the full revenue engine, from acquisition to retention and expansion.
General Revenue Metrics
Below, you'll learn about the most common strategic metrics.
Revenue Growth Rate
Revenue growth rate measures how fast your total revenue increases over time. It is one of the most important indicators of business growth and overall performance.
It matters because it shows whether your revenue operations strategy is working. Without consistent growth, it’s difficult to scale or achieve long-term revenue goals.
Formula:
Revenue Growth Rate = (Current Revenue − Previous Revenue) / Previous Revenue
Example:
Previous revenue = $1,000,000
Current revenue = $1,300,000
(1,300,000 − 1,000,000) / 1,000,000 = 0.3 → 30% growth
Insight:
Strong companies focus not only on growth, but on sustainable growth. Rapid growth with poor retention often leads to instability.
Annual Recurring Revenue (ARR)
Annual recurring revenue represents the predictable yearly revenue from subscriptions or contracts. It is a key metric for companies with a recurring revenue model.
It matters because it reflects long-term revenue stability and helps plan hiring, budgets, and investments.
Insight:
ARR should grow steadily over time. Sudden spikes may indicate short-term deals rather than stable revenue.
Monthly Recurring Revenue (MRR)
Monthly recurring revenue measures how much predictable revenue your business generates each month from paying customers.
It matters because it provides a real-time view of performance and is widely used in sales forecasting and financial planning.
Insight:
Tracking MRR trends helps identify growth, churn, and expansion in your existing customer base.
Average Revenue per Account (ARPA)
ARPA shows the average revenue per customer. It helps understand how much value each account brings.
It matters because increasing ARPA improves revenue growth without requiring more customer acquisition.
Formula:
ARPA = Total revenue / Number of customers
Example:
Total revenue = $200,000
Customers = 100
ARPA = 200,000 / 100 = $2,000
Insight:
ARPA can be increased through pricing, upselling, and better customer relationships.
Revenue per Employee
Revenue per employee measures how efficiently your company generates revenue relative to team size.
It matters because it reflects operational efficiency and the strength of your organization's revenue generating processes.
Formula:
Revenue per employee = Total revenue / Number of employees
Example:
Total revenue = $2,000,000
Employees = 20
Revenue per employee = 2,000,000 / 20 = $100,000
Insight:
Low efficiency may indicate over-hiring or weak operations.
Marketing Metrics
Below, you'll learn about the most important metrics in marketing.
Customer Acquisition Cost (CAC)
This metric measures how much you spend to acquire one new customer. It includes all sales and marketing expenses, such as ads, salaries, and tools.
It matters because it shows how efficient your customer acquisition is. If CAC is too high compared to revenue, it limits growth.
Formula:
CAC = Sales and marketing expenses / Number of new customers acquired
Example:
Sales and marketing expenses = $120,000
New customers = 60
CAC = 120,000 / 60 = $2,000
Insight:
CAC should always be compared with customer lifetime value. A common benchmark is LTV:CAC ≥ 3:1.
Marketing Qualified Leads (MQLs)
Marketing Qualified Leads are prospects that meet predefined criteria and are ready to be passed to the sales team. These are typically leads that are engaged with your marketing efforts.
It matters because it reflects the quality of lead generation, not just volume. More qualified leads usually lead to better conversion.
Insight:
A high number of leads with low MQLs indicates poor targeting or ineffective campaigns.
Lead-to-Customer Conversion Rate
This metric measures how many leads become paying customers. It shows how well your sales funnel converts demand into revenue.
It matters because it connects teams performance and highlights efficiency across the funnel.
Formula:
Conversion Rate = Number of customers / Number of leads
Example:
Leads = 500
Customers = 50
Conversion rate = 50 / 500 = 10%
Insight:
Low conversion often points to issues in qualification or the sales process.
Cost per Lead (CPL)
Cost per lead measures how much you spend to generate a single lead through your marketing efforts.
It matters because it helps evaluate the efficiency of campaigns and optimize marketing and sales expenses.
Formula:
CPL = Marketing spend / Number of leads
Example:
Marketing spend = $15,000
Leads generated = 750
CPL = 15,000 / 750 = $20
Insight:
Lower CPL is not always better. High-quality leads may cost more but convert better.
Marketing ROI
Marketing ROI measures the return generated from marketing campaigns compared to their cost.
It matters because it shows whether your efforts are profitable and scalable.
Formula:
Marketing ROI = (Revenue generated − Marketing cost) / Marketing cost
Example:
Revenue = $80,000
Cost = $20,000
ROI = (80,000 − 20,000) / 20,000 = 3 → 300%
Insight:
High ROI indicates efficient campaigns. Low ROI suggests poor targeting or messaging.
Sales Metrics
Below, you’ll learn about the most important metrics in sales.
Win Rate
Win rate measures the percentage of deals your sales team successfully closes. It reflects how effectively opportunities in your sales pipeline turn into revenue.
It matters because it directly impacts revenue growth and helps evaluate the effectiveness of your sales process.
Formula:
Win Rate = Won deals / Won deals + Lost Deals
Example:
Lost deals = 84
Won deals = 36
Win rate = 36 / 120 = 30%
Insight:
A low win rate may indicate poor qualification or weak positioning. Improving deal quality often has a bigger impact than increasing pipeline size.
Average Deal Size
Average deal size measures the average revenue generated per closed deal. It shows how much value each deal brings to your business.
It matters because increasing deal size is one of the fastest ways to drive growth without increasing deal volume.
Formula:
Average deal size = Total revenue from deals / Number of deals
Example:
Generated revenue = $600,000
Deals closed = 50
Average deal size = 600,000 / 50 = $12,000
Insight:
You can increase deal size through pricing strategy, upselling, or targeting larger accounts.
Sales Cycle Length
Such a metric as sales cycle length measures how long it takes to close a deal, from first contact to final decision. It reflects the speed of your sales pipeline.
It matters because shorter cycles improve efficiency and accelerate predictable revenue.
Formula:
Sales cycle = Close date − Deal creation date
Example:
Deal created on Jan 1
Closed on Feb 15
Sales cycle = 45 days
Insight:
Long or inconsistent cycles often signal friction in the process or weak qualification.
Pipeline Coverage Ratio
Pipeline coverage shows how much pipeline value you have compared to your revenue goals. It helps assess whether your pipeline is strong enough to hit targets.
It matters because it is one of the most important metrics for sales forecasting.
Formula:
Pipeline Coverage = Total pipeline value / Revenue target
Example:
Pipeline = $400,000
Target = $100,000
Coverage = 400,000 / 100,000 = 4x
Insight:
A common benchmark is 3x coverage, but it depends on your win rate.
Sales Velocity
Sales velocity measures how quickly your sales pipeline generates revenue. It combines deal volume, win rate, deal size, and sales cycle into one metric. It matters because it shows how fast your business can generate revenue and where to improve efficiency.
Formula:
Sales Velocity = (Number of deals × Win rate × Average deal size) / Sales cycle
Example:
Deals = 100
Win rate = 25%
Average deal size = $10,000
Cycle length = 40 days
(100 × 0.25 × 10,000) / 40 = $6,250 per day
Insight:
To increase velocity, focus on improving win rate, increasing deal size, or reducing the average sales cycle length. Tools like Forecastio help identify bottlenecks and analyze deal velocity.
Customer Success Metrics
Here are the most important Customer Success metrics:
Customer Retention Rate
Customer retention rate measures how many customers you keep over a given period. It shows how well your customer success teams maintain relationships with your existing customers.
It matters because retaining customers is essential for stable revenue and long-term growth.
Formula:
Retention Rate = (Customers at end of period − New customers) / Customers at start
Example:
Start of period = 200 customers
End of period = 210 customers
New customers = 40
Retention = (210 − 40) / 200 = 170 / 200 = 85%
Insight:
High retention means strong product value and effective customer success efforts. Low retention signals problems in onboarding or customer experience.
Churn Rate
Customer churn rate measures the percentage of customers lost during a period. It is the opposite of retention.
It matters because churn directly impacts revenue lost and limits revenue growth, especially in subscription businesses.
Formula:
Churn Rate = Lost customers / Total customers at start
Example:
Customers at start = 200
Lost customers = 20
Churn = 20 / 200 = 10%
Insight:
Even small increases in churn can significantly reduce long-term revenue. Reducing churn is often more effective than increasing new customer acquisition.
Net Revenue Retention (NRR)
Net revenue retention measures how revenue from the existing customer base changes over time, including expansion and churn.
It matters because it reflects the overall health of your customers and is one of the most important revenue metrics for SaaS businesses.
Formula:
NRR = (Starting revenue + Expansion revenue − Churned revenue) / Starting revenue
Example:
Starting revenue = $100,000
Expansion = $25,000
Churn = $10,000
NRR = (100,000 + 25,000 − 10,000) / 100,000 = 115%
Insight:
NRR above 100% means you grow even without new customers. It shows strong retention and expansion.
Expansion Revenue
Expansion revenue is additional revenue generated from existing customers through upsells, cross-sells, or upgrades.
It matters because it increases average revenue generated without additional customer acquisition cost cac.
Formula:
Expansion Revenue = Revenue from upsells + cross-sells + upgrades
Example:
Upsells = $10,000
Cross-sells = $5,000
Upgrades = $8,000
Expansion revenue = $23,000
Insight:
Strong expansion indicates high product value and strong customer relationships.
Revenue Churn Rate
Revenue churn measures how much revenue is lost from existing customers over a period. Unlike customer churn rate, it focuses on lost revenue, not just the number of customers.
It matters because losing a few large customers can have a bigger impact than losing many small ones. This makes it critical for understanding real revenue lost.
Formula:
Revenue Churn = Lost revenue from churned customers / Total starting revenue
Example:
Starting revenue = $200,000
Lost revenue = $30,000
Revenue churn = 30,000 / 200,000 = 15%
Insight:
Revenue churn gives a more accurate view of risk than customer churn. It is essential for managing recurring revenue and improving net revenue retention.
Some companies also track net promoter score as a supporting indicator of customer satisfaction. While it is not a direct revenue metric, it can help identify potential risks in retention and expansion.
Financial & Efficiency Metrics
Here are key financial and business efficiency metrics:
Customer Lifetime Value (CLV)
Customer lifetime value clv measures the total revenue a business can expect from a customer over their entire customer lifetime. It connects revenue, retention, and profitability into one metric.
It matters because it shows how much value each customer brings and helps evaluate whether your acquisition costs are sustainable.
Formula:
CLV = Average revenue per account × Customer lifetime
Example:
Average revenue per account = $2,000 per year
Average customer lifetime = 4 years
CLV = 2,000 × 4 = $8,000
Insight:
CLV should be significantly higher than CAC. A common benchmark is 3:1. This ensures profitable and scalable operations.
CAC Payback Period
CAC payback period measures how long it takes to recover your acquisition cost from revenue generated by a customer.
It matters because it shows how quickly your business turns investment into cash flow and supports sustainable growth.
Formula:
Payback Period = CAC / Monthly revenue per customer
Example:
CAC = $2,000
Monthly revenue per customer = $200
Payback period = 2,000 / 200 = 10 months
Insight:
Shorter payback periods improve cash flow and reduce risk. Long payback periods slow down scaling.
Gross Margin
Gross margin measures how much profit remains after covering the total cost of delivering your product or service.
It matters because it reflects the profitability of your revenue processes and the efficiency of your business model.
Formula:
Gross Margin = (Revenue − Cost of goods sold) / Revenue
Example:
Revenue = $100,000
Cost = $40,000
Gross margin = (100,000 − 40,000) / 100,000 = 60%
Insight:
Higher margins provide more flexibility to invest in sales, marketing, and growth initiatives.
Burn Rate
Burn rate measures how quickly a company spends cash over a period, typically monthly. It is especially important for startups and growing companies.
It matters because it shows how long the business can operate before needing additional funding.
Insight:
Managing burn rate is critical for maintaining runway and supporting growth without financial risk.
Revenue Efficiency Ratio
Revenue efficiency ratio measures how effectively your expenses generate revenue. It connects spending directly to outcomes.
It matters because it shows whether your growth is efficient and sustainable.
Formula:
Revenue Efficiency = Revenue generated / Sales and marketing expenses
Example:
Revenue = $600,000
Sales and marketing expenses = $150,000
Efficiency = 600,000 / 150,000 = 4x
Insight:
Higher efficiency means better use of resources. Low efficiency suggests issues in customer acquisition or conversion.
10 Advanced Revenue Operations Metrics
Advanced RevOps metrics go beyond standard reporting. They help identify risks inside the sales pipeline, improve sales forecasting, and uncover inefficiencies that are not visible in basic reports. These metrics are especially useful for teams that want more accurate and predictable revenue.
Revenue Leakage Rate
Revenue leakage measures how much potential revenue is lost due to inefficiencies in the revenue processes. This includes lost deals, decreased deal amounts, and deals that slip out of the period.
It matters because it shows hidden revenue lost that is not always visible in standard reports.
Formula:
Revenue Leakage Rate = (Lost revenue + Slipped revenue + Decreased deal amounts) / Total pipeline value
Example:
Lost deals = $40,000
Slipped deals = $30,000
Decreased amounts = $10,000
Total pipeline = $500,000
Leakage = (40,000 + 30,000 + 10,000) / 500,000 = 16%
Insight:
High leakage indicates problems in qualification, pricing, or execution. Reducing leakage directly improves growth without increasing pipeline.
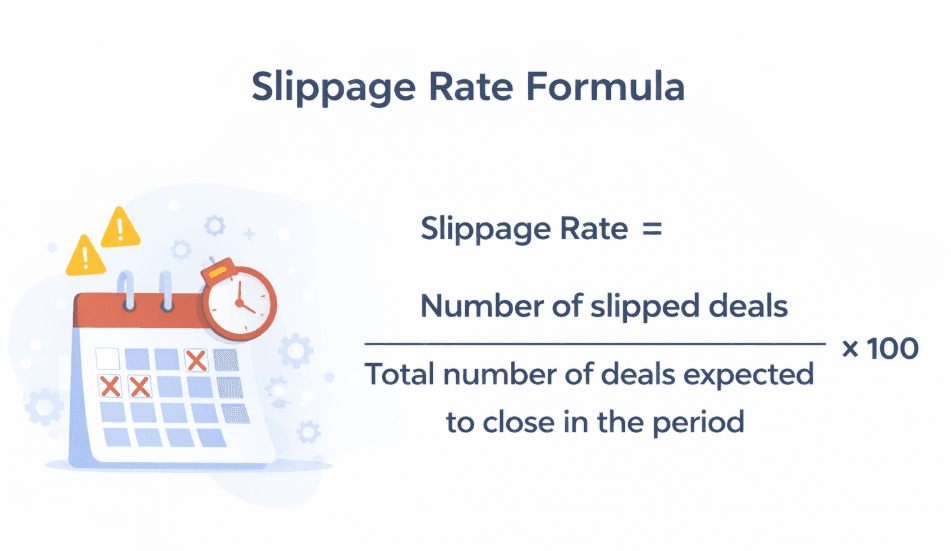
Deal Slippage Rate
Deal slippage measures how many deals move from the expected close period to a later one. It reflects delays in the sales cycle.
It matters because high slippage reduces forecast accuracy and delays revenue.
Formula:
Slippage Rate = Number of slipped deals / Total deals expected to close
Example:
Expected deals = 80
Slipped deals = 20
Slippage = 20 / 80 = 25%
Insight:
High slippage often points to unrealistic close dates or weak sales pipeline management.
Pipeline Health Score
Pipeline health score is a composite metric that evaluates the quality of your sales pipeline. It typically includes deal activity, aging, and conversion rates.
It matters because pipeline size alone does not guarantee growth.
Formula:
No single formula. Usually based on weighted factors such as:
Deal activity
Time in stage
Conversion probability
Example:
Pipeline scored at 72/100 based on activity and aging indicators
Insight:
Tools like Forecastio calculate this automatically and highlight risky deals before they impact revenue.
Forecast Accuracy
Forecast accuracy measures how close your predicted revenue is to actual results. It is a core metric for evaluating sales forecasting performance.
It matters because inaccurate forecasts lead to poor planning and missed revenue goals.
Formula:
Forecast Accuracy = 1 − |Forecast − Actual| / Actual
Example:
Forecast = $120,000
Actual = $100,000
Accuracy = 1 − (20,000 / 100,000) = 80%
Insight:
Consistently low accuracy indicates issues in pipeline visibility or over-optimistic forecasts.
Deal Velocity Distribution (avg vs median)
This metric compares average and median deal cycle length or deal duration to identify outliers.
It matters because averages can be distorted by a few large or slow deals.
Formula:
No single formula. Compare:
Average deal duration
Median deal duration
Example:
Average = 60 days
Median = 35 days
Insight:
A large gap suggests that some deals are stuck or unusually slow, which affects the overall sales process.
Stage Conversion Decay
Stage conversion decay measures how conversion rates drop over time at each stage of the sales funnel.
It matters because it helps identify weak points in the pipeline where deals stop progressing.
Formula:
Conversion Decay = Conversion rate at stage over time
Example:
Stage conversion drops from 50% to 30% over 3 months
Insight:
Declining conversion often signals poor qualification or changes in the sales process.
Pipeline Aging
Pipeline aging measures how long deals stay open in the sales pipeline. It highlights delays and inefficiencies.
It matters because older deals are less likely to close and reduce forecast reliability.
Formula:
Pipeline Aging = Average time deals remain open
Example:
Average deal age = 75 days
Insight:
Aging pipelines often indicate stalled deals or weak follow-up from the sales team.
No-Decision Rate
No-decision rate measures how many deals end without a clear win or loss. These are deals that stall or disappear.
It matters because these deals represent hidden inefficiencies and lost opportunities.
Formula:
No-Decision Rate = No-decision deals / Total deals
Example:
No-decision deals = 25
Total deals = 100
Rate = 25 / 100 = 25%
Insight:
High no-decision rates often point to a weak value proposition, poor qualification, or bad deal control.
Commit vs Actual Accuracy
This metric compares what sales reps commit to closing versus what actually closes.
It matters because it reflects discipline and reliability in forecasting.
Formula:
Accuracy = Actual revenue / Committed revenue
Example:
Committed = $200,000
Actual = $150,000
Accuracy = 150,000 / 200,000 = 75%
Insight:
Low accuracy indicates overcommitment and weak forecast discipline.
At-Risk Pipeline Percentage
This metric measures the portion of the sales pipeline that is considered risky based on inactivity, delays, or weak signals.
It matters because it helps identify deals that may not close and impact forecasts.
Formula:
At-Risk Pipeline = Risky deals value / Total pipeline value
Example:
Risky deals = $120,000
Pipeline = $400,000
At-risk = 120,000 / 400,000 = 30%
Insight:
High risk levels require immediate action. This is where tools like Forecastio help by flagging risky deals early.
How to Choose the Right RevOps Metrics for Your Business
Choosing the right metrics depends on your business model, growth stage, and revenue structure. Not all metrics are equally useful, and tracking too many can create confusion. The goal is to focus on the metrics that directly impact performance, efficiency, and long-term sustainable growth.
Metrics by company stage (startup vs scale-up)
At different stages, companies should focus on different priorities.
Startups typically focus on:
Customer acquisition
Conversion of leads into paying customers
Early signs of product-market fit
At this stage, tracking customer satisfaction is also important. Metrics like net promoter score can help validate whether customers see real value and identify early signals of churn or expansion potential.
Scale-ups shift focus toward:
Retention and expansion of existing customers
Improving customer lifetime value
Increasing net revenue retention
As the business grows, strong customer success teams become critical. They ensure that customers stay engaged and continue to generate revenue over time.
Metrics by sales model (SMB vs enterprise)
The sales model affects which sales operations and revenue operations kpis and metrics should be prioritized. SMB and enterprise sales require different approaches to measurement and decision-making.
For SMB-focused companies, the focus is on speed and volume. The most relevant metrics include:
Sales cycle length
Lead-to-customer conversion rate
Sales velocity
These metrics help optimize fast-moving pipelines and improve efficiency in converting leads into paying customers. In this model, small improvements in conversion or speed can significantly impact growth.
For enterprise-focused companies, the focus shifts to deal quality and long-term value. Key metrics include:
Average deal size
Win rate by segment
Net revenue retention
Expansion revenue
Deal slippage rate
In enterprise sales, closing the deal is only part of the process. Strong customer success and high customer satisfaction are essential for retaining large accounts and driving long-term revenue. This makes retention and expansion metrics just as important as initial conversion.
Avoiding vanity metrics
One of the most common mistakes is tracking metrics that don’t impact outcomes.
Examples include:
Number of leads without conversion
Pipeline size without quality
Activity without revenue impact
Instead, companies should focus on key metrics that directly influence revenue:
Conversion rates
Retention
Expansion
Metrics should reflect real performance, not just activity.
A good rule is simple. If a metric doesn’t help improve decisions or outcomes, it probably shouldn’t be tracked.
How to Build a Revenue Operations Metrics Framework
A strong metrics framework helps turn data into consistent decisions. It ensures that teams track the same numbers, understand them in the same way, and use them to improve performance. Without a clear structure, even the best metrics won’t drive results or support sustainable growth.
Define your revenue model
Start by clearly defining how your business generates revenue. This includes understanding your pricing model, deal structure, and how revenue flows through the organization.
For example, companies with recurring revenue models should focus more on retention, expansion, and customer lifetime value. Businesses with transactional sales may prioritize customer acquisition cost and deal volume.
Your revenue model determines which revenue metrics matter most. It also helps align revenue operations professionals around the same logic and expectations.
Map the full funnel (lead → revenue → retention)
Next, map your entire revenue journey. This includes every stage from lead generation to closing deals and retaining customers.
A simple structure:
Lead → Opportunity → Customer → Expansion
Each stage should have clear metrics. For example:
Conversion rates in the sales funnel
Pipeline coverage in the sales pipeline
Retention and expansion driven by customer success teams
This approach helps identify where revenue slows down and where improvements are needed.
Align teams on shared definitions
Metrics only work if everyone understands them the same way. Misalignment between marketing, sales and customer success teams leads to confusion and incorrect reporting.
For example:
What qualifies as a lead?
When is a deal considered closed?
How is churn defined?
Clear definitions ensure that all teams track the same key metrics and work toward shared business goals.
This alignment also improves collaboration between sales, marketing, and customer success functions.
Build dashboards and reporting
Finally, metrics need to be visible and easy to use. Dashboards should focus on the most important numbers and avoid unnecessary complexity.
Effective dashboards:
Highlight key trends
Show performance against targets
Help teams make decisions quickly
Tools like HubSpot provide basic reporting, while platforms like Forecastio add deeper insights into pipeline quality, risks, and sales forecasting.
The goal is not just to track data, but to use it to improve performance and maintain strong customer satisfaction over time.
Tools for Tracking Revenue Operations Metrics
Tracking revenue operations metrics requires the right tools. Without proper systems, data becomes fragmented and hard to use. The goal is to build a single source of truth that supports decision-making across marketing, sales, and customer success.
CRM systems
CRM systems are the foundation of any revenue operations setup. They store data about leads, deals, and paying customers, and track activity across the sales pipeline.
Popular CRM tools:
They are used for:
Managing the sales funnel
Tracking deal progression
Supporting daily work of the sales team
Most CRM systems provide basic sales metrics, but they often lack deeper insights into forecasting and pipeline quality.
BI and analytics tools
BI tools help analyze and visualize data from multiple sources. They are useful for building dashboards and tracking trends across the business.
Popular BI tools:
They allow teams to:
Combine data from marketing, sales, and customer success
Track trends in growth
Build custom dashboards for different teams
However, they require setup and ongoing maintenance, and they depend heavily on clean data.
Revenue intelligence platforms
Revenue intelligence platforms collect and analyze data from across the revenue process, including CRM activity, emails, calls, and deal interactions. They help teams understand what is actually happening behind the numbers and how it impacts outcomes.
They matter because they provide context, not just metrics. Instead of only showing pipeline value or forecasts, they explain why deals move, stall, or close.
Examples include:
These platforms provide:
Forecasting models and accuracy tracking
Pipeline health and risk analysis
Visibility into deal movement and delays
They also support customer success teams by improving visibility into renewals or expansion potential.
Conclusion: Turning RevOps Metrics into Revenue Growth
Revenue operations metrics are only valuable if they lead to action. Tracking data alone doesn't improve results. What matters is how teams use these insights to make better decisions and improve performance.
The most effective companies focus on a small set of key metrics that directly impact outcomes. They align marketing and sales teams with customer success teams, improve customer satisfaction of your customers, supported by indicators like net promoter score, and build systems that support consistent execution. This is what enables more predictable performance and long-term sustainable growth.
In practice, strong revenue operations are not about tracking everything. It's about understanding what drives revenue, identifying weak points in the process, and continuously improving them. This includes everything from customer acquisition to retention and expansion.
Tools like Forecastio help take this further. They don't just track metrics. They help explain what is happening inside the pipeline and how to improve it.
In the end, companies that succeed are those that turn data into decisions and decisions into results.
What Are Revenue Operations Metrics?
Revenue operations metrics are measurable indicators that track how effectively a company generates, converts, and retains revenue. They provide a unified view across marketing, sales, and customer success, instead of looking at each team separately. This helps companies understand the full revenue flow and improve decision-making.
Definition of RevOps metrics
RevOps metrics are key metrics used to measure performance across the entire revenue journey, from customer acquisition to retention and expansion. They focus on outcomes, not just activity.
These metrics include areas such as:
Pipeline performance
Conversion rates
Retention and expansion
Overall revenue growth
Unlike isolated sales metrics or marketing metrics, they reflect how the whole system works together.
How RevOps metrics connect marketing, sales, and customer success
Revenue is generated through combined sales and marketing efforts and ongoing customer success efforts. RevOps metrics connect these stages into one continuous process.
For example:
Marketing brings in qualified leads
The sales team converts them into customers
Customer success focuses on retaining customers and driving expansion revenue
By tracking shared metrics across this flow, companies improve alignment and gain better visibility into the sales funnel.
RevOps metrics vs traditional departmental metrics
Traditional metrics focus on individual teams. RevOps metrics focus on the entire revenue system.
For example:
Marketing tracks cost per lead
Sales tracks win rate
RevOps tracks metrics like customer lifetime value (CLV) or net revenue retention
The difference is that revenue operations metrics show how all activities contribute to total revenue. This makes them more useful for strategic decisions and long-term revenue growth.
Why Revenue Operations Metrics Matter
Revenue operations metrics help companies understand how revenue is generated, where it is lost, and how to improve performance across the funnel. They connect marketing, sales, and customer success into one system and make revenue more predictable. Without them, teams rely on assumptions instead of data, which slows down business growth.
They align marketing, sales, and customer success into one revenue system
One of the main reasons revenue operations metrics matter is alignment. In many companies, marketing and sales teams and customer success work separately, each tracking their own numbers.
A unified approach connects the full sales funnel, from lead generation to closing deals and retaining customers. It ensures all teams focus on shared outcomes instead of isolated targets. This improves collaboration and gives better visibility into how revenue is actually generated.
They reveal what actually drives revenue (and what doesn’t)
Many teams track activity, but not outcomes. They focus on pipeline size or lead volume, but these don’t always translate into revenue growth.
The right revenue metrics highlight what truly matters, such as conversion rates, deal progression, and retention. For example, a large sales pipeline is not useful if deals don’t convert. These insights help teams identify weak points in the sales process and focus on what actually drives results.
They improve forecasting accuracy and predictability
Forecasting becomes more reliable when it is based on data instead of opinion. Revops metrics improve sales forecasting by tracking pipeline coverage, conversion rates, and deal movement.
According to Gartner, fewer than half of sales leaders fully trust their forecasts. This often comes from poor visibility into pipeline quality. When teams rely on structured metrics, they can build more accurate forecasts and achieve more predictable revenue.
They help improve efficiency and reduce revenue leakage
Revenue is often lost due to inefficiencies in the sales operations and marketing operations. Deals may stall, slip, or fail to close due to poor qualification or inconsistent execution.
Revenue operations metrics help identify where revenue is lost and how effective sales and marketing expenses are. This allows teams to improve efficiency and optimize their workflows.
They enable sustainable and scalable business growth
Strong RevOps metrics support long-term sustainable growth by improving both acquisition and retention. They help increase customer lifetime value and strengthen relationships with the existing customer base.
Over time, this leads to more stable performance and better planning. Companies can scale their revenue operations while maintaining consistency and control.
Revenue Operations Metrics vs KPIs: What's the Difference?
Revenue operations metrics and key performance indicators are closely related, but they serve different purposes. Metrics track what is happening in your business. KPIs define what success looks like based on your business goals.
RevOps metrics are the building blocks. They measure performance across the sales funnel, including conversion rates, pipeline value, and retention. These metrics help teams understand how their revenue processes are working on a daily basis.
Revenue operations KPIs, on the other hand, are selected metrics that are tied to outcomes. They are used to evaluate whether the company is hitting its revenue goals and driving revenue growth.
Here is a simple way to think about it:
A metric is something you track
A KPI is something you aim to achieve
Example:
Metric: sales cycle length = 45 days
KPI: reduce average sales cycle length to 35 days
Another example:
Metric: customer acquisition cost = $2,000
KPI: reduce CAC to $1,500 while maintaining growth
The problem is that many teams treat all metrics as equally important. This leads to overload and lack of focus. Instead of tracking everything, companies should define a small set of revenue operations kpis that directly impact total revenue and efficiency.
In practice, strong revenue operations uses both:
Metrics to monitor performance
KPIs to drive decisions
This balance helps teams stay focused, improve sales performance, and build more predictable results.
Types of Revenue Operations Metrics
RevOps metrics can be grouped into three main types: strategic, tactical, and operational. Each type reflects a different level of decision-making and covers the full journey across marketing, sales, and customer success. Together, they provide a complete view of how revenue is generated and scaled.
Strategic metrics (growth & revenue health)
Strategic metrics focus on long-term performance and overall revenue growth. They show whether the business is achieving its business goals and building a stable revenue model.
These metrics include:
Annual recurring revenue and monthly recurring revenue
Net revenue retention
Customer lifetime value
They reflect how well the company acquires, retains, and expands its existing customer base. Strategic metrics are used by leadership to guide planning, investment decisions, and long-term revenue strategy.
Tactical metrics (pipeline, conversion, and retention performance)
Tactical metrics focus on how efficiently revenue is generated across the funnel. They cover marketing conversion, sales execution, and customer retention.
Examples include:
Lead-to-opportunity conversion from marketing
Win rate and sales velocity in the sales pipeline
Retention and expansion from customer success efforts
These metrics help teams understand where deals slow down, where conversions drop, and how well customers are retained. They are essential for improving the sales process, optimizing the funnel, and supporting accurate sales forecasting.
Operational metrics (execution across teams)
Operational metrics track day-to-day execution across marketing, sales and customer success teams. They show how consistently teams perform the activities that drive results.
Examples include:
Campaign performance and lead response time in marketing
Calls, meetings, and follow-ups in sales
Onboarding progress and engagement in customer success
These operations metrics are useful for managing execution, but they should always be connected to outcomes. On their own, they don’t drive total revenue, but they influence how effectively the system performs.
25 Key Revenue Operations Metrics Every Team Should Track
RevOps metrics help companies understand how revenue is generated, how efficiently teams operate, and where improvements are needed. Below are the most important metrics across the full revenue engine, from acquisition to retention and expansion.
General Revenue Metrics
Below, you'll learn about the most common strategic metrics.
Revenue Growth Rate
Revenue growth rate measures how fast your total revenue increases over time. It is one of the most important indicators of business growth and overall performance.
It matters because it shows whether your revenue operations strategy is working. Without consistent growth, it’s difficult to scale or achieve long-term revenue goals.
Formula:
Revenue Growth Rate = (Current Revenue − Previous Revenue) / Previous Revenue
Example:
Previous revenue = $1,000,000
Current revenue = $1,300,000
(1,300,000 − 1,000,000) / 1,000,000 = 0.3 → 30% growth
Insight:
Strong companies focus not only on growth, but on sustainable growth. Rapid growth with poor retention often leads to instability.
Annual Recurring Revenue (ARR)
Annual recurring revenue represents the predictable yearly revenue from subscriptions or contracts. It is a key metric for companies with a recurring revenue model.
It matters because it reflects long-term revenue stability and helps plan hiring, budgets, and investments.
Insight:
ARR should grow steadily over time. Sudden spikes may indicate short-term deals rather than stable revenue.
Monthly Recurring Revenue (MRR)
Monthly recurring revenue measures how much predictable revenue your business generates each month from paying customers.
It matters because it provides a real-time view of performance and is widely used in sales forecasting and financial planning.
Insight:
Tracking MRR trends helps identify growth, churn, and expansion in your existing customer base.
Average Revenue per Account (ARPA)
ARPA shows the average revenue per customer. It helps understand how much value each account brings.
It matters because increasing ARPA improves revenue growth without requiring more customer acquisition.
Formula:
ARPA = Total revenue / Number of customers
Example:
Total revenue = $200,000
Customers = 100
ARPA = 200,000 / 100 = $2,000
Insight:
ARPA can be increased through pricing, upselling, and better customer relationships.
Revenue per Employee
Revenue per employee measures how efficiently your company generates revenue relative to team size.
It matters because it reflects operational efficiency and the strength of your organization's revenue generating processes.
Formula:
Revenue per employee = Total revenue / Number of employees
Example:
Total revenue = $2,000,000
Employees = 20
Revenue per employee = 2,000,000 / 20 = $100,000
Insight:
Low efficiency may indicate over-hiring or weak operations.
Marketing Metrics
Below, you'll learn about the most important metrics in marketing.
Customer Acquisition Cost (CAC)
This metric measures how much you spend to acquire one new customer. It includes all sales and marketing expenses, such as ads, salaries, and tools.
It matters because it shows how efficient your customer acquisition is. If CAC is too high compared to revenue, it limits growth.
Formula:
CAC = Sales and marketing expenses / Number of new customers acquired
Example:
Sales and marketing expenses = $120,000
New customers = 60
CAC = 120,000 / 60 = $2,000
Insight:
CAC should always be compared with customer lifetime value. A common benchmark is LTV:CAC ≥ 3:1.
Marketing Qualified Leads (MQLs)
Marketing Qualified Leads are prospects that meet predefined criteria and are ready to be passed to the sales team. These are typically leads that are engaged with your marketing efforts.
It matters because it reflects the quality of lead generation, not just volume. More qualified leads usually lead to better conversion.
Insight:
A high number of leads with low MQLs indicates poor targeting or ineffective campaigns.
Lead-to-Customer Conversion Rate
This metric measures how many leads become paying customers. It shows how well your sales funnel converts demand into revenue.
It matters because it connects teams performance and highlights efficiency across the funnel.
Formula:
Conversion Rate = Number of customers / Number of leads
Example:
Leads = 500
Customers = 50
Conversion rate = 50 / 500 = 10%
Insight:
Low conversion often points to issues in qualification or the sales process.
Cost per Lead (CPL)
Cost per lead measures how much you spend to generate a single lead through your marketing efforts.
It matters because it helps evaluate the efficiency of campaigns and optimize marketing and sales expenses.
Formula:
CPL = Marketing spend / Number of leads
Example:
Marketing spend = $15,000
Leads generated = 750
CPL = 15,000 / 750 = $20
Insight:
Lower CPL is not always better. High-quality leads may cost more but convert better.
Marketing ROI
Marketing ROI measures the return generated from marketing campaigns compared to their cost.
It matters because it shows whether your efforts are profitable and scalable.
Formula:
Marketing ROI = (Revenue generated − Marketing cost) / Marketing cost
Example:
Revenue = $80,000
Cost = $20,000
ROI = (80,000 − 20,000) / 20,000 = 3 → 300%
Insight:
High ROI indicates efficient campaigns. Low ROI suggests poor targeting or messaging.
Sales Metrics
Below, you’ll learn about the most important metrics in sales.
Win Rate
Win rate measures the percentage of deals your sales team successfully closes. It reflects how effectively opportunities in your sales pipeline turn into revenue.
It matters because it directly impacts revenue growth and helps evaluate the effectiveness of your sales process.
Formula:
Win Rate = Won deals / Won deals + Lost Deals
Example:
Lost deals = 84
Won deals = 36
Win rate = 36 / 120 = 30%
Insight:
A low win rate may indicate poor qualification or weak positioning. Improving deal quality often has a bigger impact than increasing pipeline size.
Average Deal Size
Average deal size measures the average revenue generated per closed deal. It shows how much value each deal brings to your business.
It matters because increasing deal size is one of the fastest ways to drive growth without increasing deal volume.
Formula:
Average deal size = Total revenue from deals / Number of deals
Example:
Generated revenue = $600,000
Deals closed = 50
Average deal size = 600,000 / 50 = $12,000
Insight:
You can increase deal size through pricing strategy, upselling, or targeting larger accounts.
Sales Cycle Length
Such a metric as sales cycle length measures how long it takes to close a deal, from first contact to final decision. It reflects the speed of your sales pipeline.
It matters because shorter cycles improve efficiency and accelerate predictable revenue.
Formula:
Sales cycle = Close date − Deal creation date
Example:
Deal created on Jan 1
Closed on Feb 15
Sales cycle = 45 days
Insight:
Long or inconsistent cycles often signal friction in the process or weak qualification.
Pipeline Coverage Ratio
Pipeline coverage shows how much pipeline value you have compared to your revenue goals. It helps assess whether your pipeline is strong enough to hit targets.
It matters because it is one of the most important metrics for sales forecasting.
Formula:
Pipeline Coverage = Total pipeline value / Revenue target
Example:
Pipeline = $400,000
Target = $100,000
Coverage = 400,000 / 100,000 = 4x
Insight:
A common benchmark is 3x coverage, but it depends on your win rate.
Sales Velocity
Sales velocity measures how quickly your sales pipeline generates revenue. It combines deal volume, win rate, deal size, and sales cycle into one metric. It matters because it shows how fast your business can generate revenue and where to improve efficiency.
Formula:
Sales Velocity = (Number of deals × Win rate × Average deal size) / Sales cycle
Example:
Deals = 100
Win rate = 25%
Average deal size = $10,000
Cycle length = 40 days
(100 × 0.25 × 10,000) / 40 = $6,250 per day
Insight:
To increase velocity, focus on improving win rate, increasing deal size, or reducing the average sales cycle length. Tools like Forecastio help identify bottlenecks and analyze deal velocity.
Customer Success Metrics
Here are the most important Customer Success metrics:
Customer Retention Rate
Customer retention rate measures how many customers you keep over a given period. It shows how well your customer success teams maintain relationships with your existing customers.
It matters because retaining customers is essential for stable revenue and long-term growth.
Formula:
Retention Rate = (Customers at end of period − New customers) / Customers at start
Example:
Start of period = 200 customers
End of period = 210 customers
New customers = 40
Retention = (210 − 40) / 200 = 170 / 200 = 85%
Insight:
High retention means strong product value and effective customer success efforts. Low retention signals problems in onboarding or customer experience.
Churn Rate
Customer churn rate measures the percentage of customers lost during a period. It is the opposite of retention.
It matters because churn directly impacts revenue lost and limits revenue growth, especially in subscription businesses.
Formula:
Churn Rate = Lost customers / Total customers at start
Example:
Customers at start = 200
Lost customers = 20
Churn = 20 / 200 = 10%
Insight:
Even small increases in churn can significantly reduce long-term revenue. Reducing churn is often more effective than increasing new customer acquisition.
Net Revenue Retention (NRR)
Net revenue retention measures how revenue from the existing customer base changes over time, including expansion and churn.
It matters because it reflects the overall health of your customers and is one of the most important revenue metrics for SaaS businesses.
Formula:
NRR = (Starting revenue + Expansion revenue − Churned revenue) / Starting revenue
Example:
Starting revenue = $100,000
Expansion = $25,000
Churn = $10,000
NRR = (100,000 + 25,000 − 10,000) / 100,000 = 115%
Insight:
NRR above 100% means you grow even without new customers. It shows strong retention and expansion.
Expansion Revenue
Expansion revenue is additional revenue generated from existing customers through upsells, cross-sells, or upgrades.
It matters because it increases average revenue generated without additional customer acquisition cost cac.
Formula:
Expansion Revenue = Revenue from upsells + cross-sells + upgrades
Example:
Upsells = $10,000
Cross-sells = $5,000
Upgrades = $8,000
Expansion revenue = $23,000
Insight:
Strong expansion indicates high product value and strong customer relationships.
Revenue Churn Rate
Revenue churn measures how much revenue is lost from existing customers over a period. Unlike customer churn rate, it focuses on lost revenue, not just the number of customers.
It matters because losing a few large customers can have a bigger impact than losing many small ones. This makes it critical for understanding real revenue lost.
Formula:
Revenue Churn = Lost revenue from churned customers / Total starting revenue
Example:
Starting revenue = $200,000
Lost revenue = $30,000
Revenue churn = 30,000 / 200,000 = 15%
Insight:
Revenue churn gives a more accurate view of risk than customer churn. It is essential for managing recurring revenue and improving net revenue retention.
Some companies also track net promoter score as a supporting indicator of customer satisfaction. While it is not a direct revenue metric, it can help identify potential risks in retention and expansion.
Financial & Efficiency Metrics
Here are key financial and business efficiency metrics:
Customer Lifetime Value (CLV)
Customer lifetime value clv measures the total revenue a business can expect from a customer over their entire customer lifetime. It connects revenue, retention, and profitability into one metric.
It matters because it shows how much value each customer brings and helps evaluate whether your acquisition costs are sustainable.
Formula:
CLV = Average revenue per account × Customer lifetime
Example:
Average revenue per account = $2,000 per year
Average customer lifetime = 4 years
CLV = 2,000 × 4 = $8,000
Insight:
CLV should be significantly higher than CAC. A common benchmark is 3:1. This ensures profitable and scalable operations.
CAC Payback Period
CAC payback period measures how long it takes to recover your acquisition cost from revenue generated by a customer.
It matters because it shows how quickly your business turns investment into cash flow and supports sustainable growth.
Formula:
Payback Period = CAC / Monthly revenue per customer
Example:
CAC = $2,000
Monthly revenue per customer = $200
Payback period = 2,000 / 200 = 10 months
Insight:
Shorter payback periods improve cash flow and reduce risk. Long payback periods slow down scaling.
Gross Margin
Gross margin measures how much profit remains after covering the total cost of delivering your product or service.
It matters because it reflects the profitability of your revenue processes and the efficiency of your business model.
Formula:
Gross Margin = (Revenue − Cost of goods sold) / Revenue
Example:
Revenue = $100,000
Cost = $40,000
Gross margin = (100,000 − 40,000) / 100,000 = 60%
Insight:
Higher margins provide more flexibility to invest in sales, marketing, and growth initiatives.
Burn Rate
Burn rate measures how quickly a company spends cash over a period, typically monthly. It is especially important for startups and growing companies.
It matters because it shows how long the business can operate before needing additional funding.
Insight:
Managing burn rate is critical for maintaining runway and supporting growth without financial risk.
Revenue Efficiency Ratio
Revenue efficiency ratio measures how effectively your expenses generate revenue. It connects spending directly to outcomes.
It matters because it shows whether your growth is efficient and sustainable.
Formula:
Revenue Efficiency = Revenue generated / Sales and marketing expenses
Example:
Revenue = $600,000
Sales and marketing expenses = $150,000
Efficiency = 600,000 / 150,000 = 4x
Insight:
Higher efficiency means better use of resources. Low efficiency suggests issues in customer acquisition or conversion.
10 Advanced Revenue Operations Metrics
Advanced RevOps metrics go beyond standard reporting. They help identify risks inside the sales pipeline, improve sales forecasting, and uncover inefficiencies that are not visible in basic reports. These metrics are especially useful for teams that want more accurate and predictable revenue.
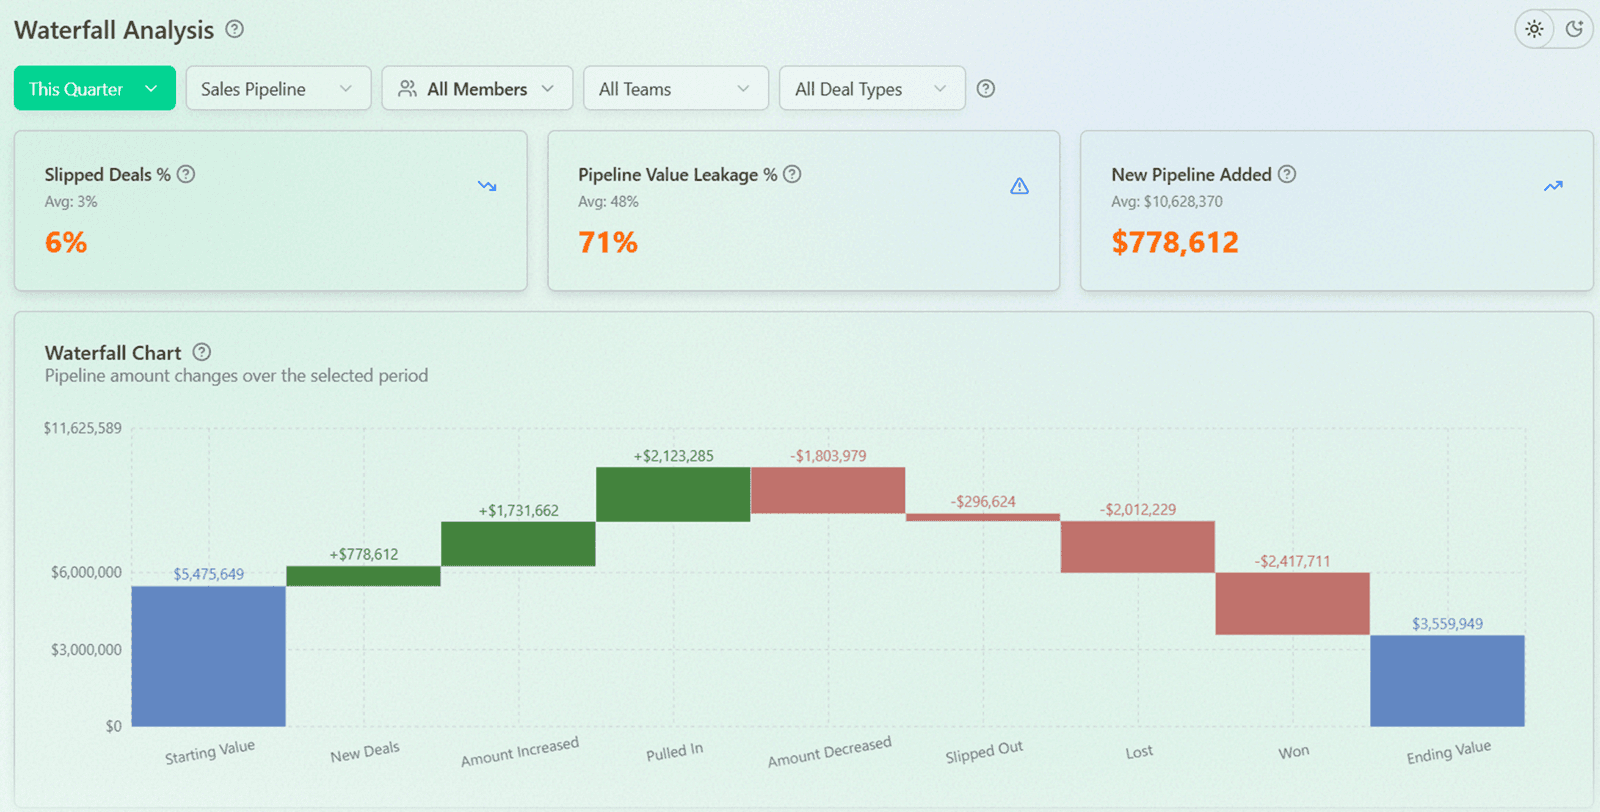
Revenue Leakage Rate
Revenue leakage measures how much potential revenue is lost due to inefficiencies in the revenue processes. This includes lost deals, decreased deal amounts, and deals that slip out of the period.
It matters because it shows hidden revenue lost that is not always visible in standard reports.
Formula:
Revenue Leakage Rate = (Lost revenue + Slipped revenue + Decreased deal amounts) / Total pipeline value
Example:
Lost deals = $40,000
Slipped deals = $30,000
Decreased amounts = $10,000
Total pipeline = $500,000
Leakage = (40,000 + 30,000 + 10,000) / 500,000 = 16%
Insight:
High leakage indicates problems in qualification, pricing, or execution. Reducing leakage directly improves growth without increasing pipeline.
Deal Slippage Rate
Deal slippage measures how many deals move from the expected close period to a later one. It reflects delays in the sales cycle.
It matters because high slippage reduces forecast accuracy and delays revenue.
Formula:
Slippage Rate = Number of slipped deals / Total deals expected to close
Example:
Expected deals = 80
Slipped deals = 20
Slippage = 20 / 80 = 25%
Insight:
High slippage often points to unrealistic close dates or weak sales pipeline management.
Pipeline Health Score
Pipeline health score is a composite metric that evaluates the quality of your sales pipeline. It typically includes deal activity, aging, and conversion rates.
It matters because pipeline size alone does not guarantee growth.
Formula:
No single formula. Usually based on weighted factors such as:
Deal activity
Time in stage
Conversion probability
Example:
Pipeline scored at 72/100 based on activity and aging indicators
Insight:
Tools like Forecastio calculate this automatically and highlight risky deals before they impact revenue.
Forecast Accuracy
Forecast accuracy measures how close your predicted revenue is to actual results. It is a core metric for evaluating sales forecasting performance.
It matters because inaccurate forecasts lead to poor planning and missed revenue goals.
Formula:
Forecast Accuracy = 1 − |Forecast − Actual| / Actual
Example:
Forecast = $120,000
Actual = $100,000
Accuracy = 1 − (20,000 / 100,000) = 80%
Insight:
Consistently low accuracy indicates issues in pipeline visibility or over-optimistic forecasts.
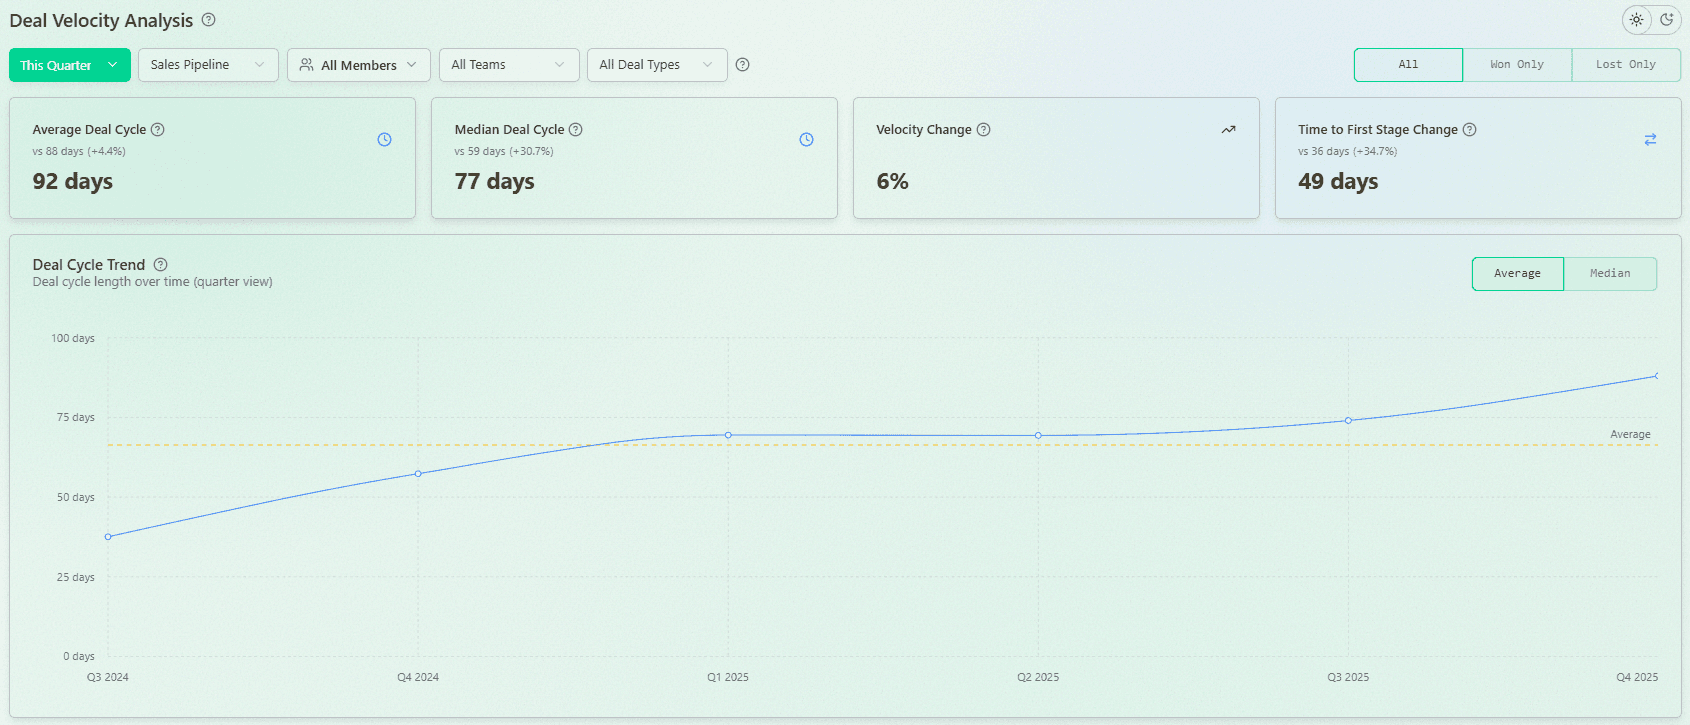
Deal Velocity Distribution (avg vs median)
This metric compares average and median deal cycle length or deal duration to identify outliers.
It matters because averages can be distorted by a few large or slow deals.
Formula:
No single formula. Compare:
Average deal duration
Median deal duration
Example:
Average = 60 days
Median = 35 days
Insight:
A large gap suggests that some deals are stuck or unusually slow, which affects the overall sales process.
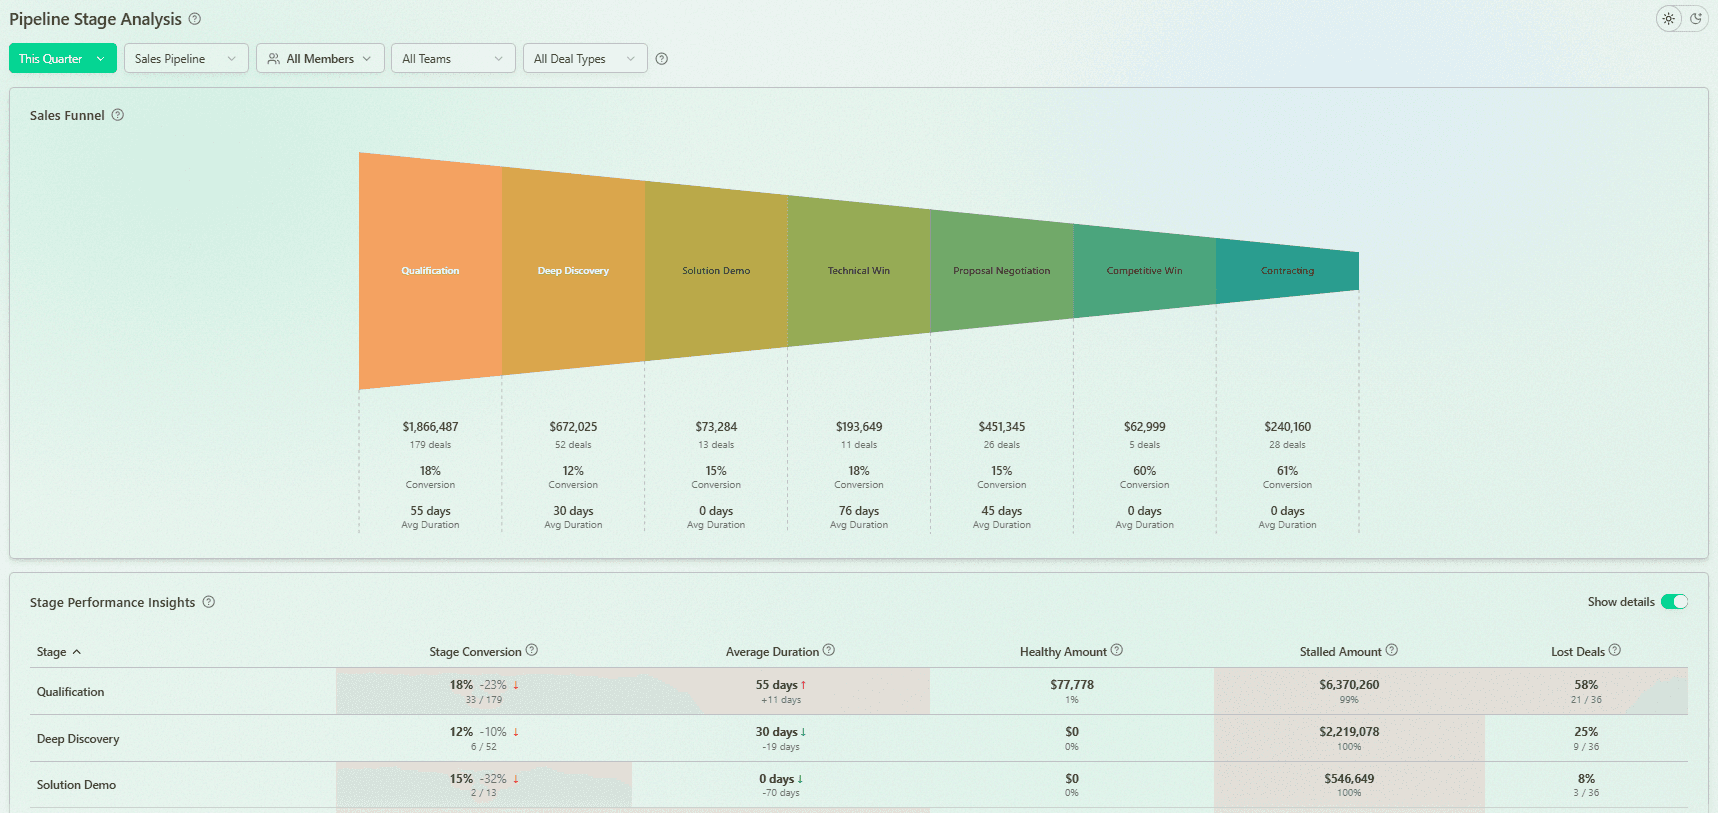
Stage Conversion Decay
Stage conversion decay measures how conversion rates drop over time at each stage of the sales funnel.
It matters because it helps identify weak points in the pipeline where deals stop progressing.
Formula:
Conversion Decay = Conversion rate at stage over time
Example:
Stage conversion drops from 50% to 30% over 3 months
Insight:
Declining conversion often signals poor qualification or changes in the sales process.
Pipeline Aging
Pipeline aging measures how long deals stay open in the sales pipeline. It highlights delays and inefficiencies.
It matters because older deals are less likely to close and reduce forecast reliability.
Formula:
Pipeline Aging = Average time deals remain open
Example:
Average deal age = 75 days
Insight:
Aging pipelines often indicate stalled deals or weak follow-up from the sales team.
No-Decision Rate
No-decision rate measures how many deals end without a clear win or loss. These are deals that stall or disappear.
It matters because these deals represent hidden inefficiencies and lost opportunities.
Formula:
No-Decision Rate = No-decision deals / Total deals
Example:
No-decision deals = 25
Total deals = 100
Rate = 25 / 100 = 25%
Insight:
High no-decision rates often point to a weak value proposition, poor qualification, or bad deal control.
Commit vs Actual Accuracy
This metric compares what sales reps commit to closing versus what actually closes.
It matters because it reflects discipline and reliability in forecasting.
Formula:
Accuracy = Actual revenue / Committed revenue
Example:
Committed = $200,000
Actual = $150,000
Accuracy = 150,000 / 200,000 = 75%
Insight:
Low accuracy indicates overcommitment and weak forecast discipline.
At-Risk Pipeline Percentage
This metric measures the portion of the sales pipeline that is considered risky based on inactivity, delays, or weak signals.
It matters because it helps identify deals that may not close and impact forecasts.
Formula:
At-Risk Pipeline = Risky deals value / Total pipeline value
Example:
Risky deals = $120,000
Pipeline = $400,000
At-risk = 120,000 / 400,000 = 30%
Insight:
High risk levels require immediate action. This is where tools like Forecastio help by flagging risky deals early.
How to Choose the Right RevOps Metrics for Your Business
Choosing the right metrics depends on your business model, growth stage, and revenue structure. Not all metrics are equally useful, and tracking too many can create confusion. The goal is to focus on the metrics that directly impact performance, efficiency, and long-term sustainable growth.
Metrics by company stage (startup vs scale-up)
At different stages, companies should focus on different priorities.
Startups typically focus on:
Customer acquisition
Conversion of leads into paying customers
Early signs of product-market fit
At this stage, tracking customer satisfaction is also important. Metrics like net promoter score can help validate whether customers see real value and identify early signals of churn or expansion potential.
Scale-ups shift focus toward:
Retention and expansion of existing customers
Improving customer lifetime value
Increasing net revenue retention
As the business grows, strong customer success teams become critical. They ensure that customers stay engaged and continue to generate revenue over time.
Metrics by sales model (SMB vs enterprise)
The sales model affects which sales operations and revenue operations kpis and metrics should be prioritized. SMB and enterprise sales require different approaches to measurement and decision-making.
For SMB-focused companies, the focus is on speed and volume. The most relevant metrics include:
Sales cycle length
Lead-to-customer conversion rate
Sales velocity
These metrics help optimize fast-moving pipelines and improve efficiency in converting leads into paying customers. In this model, small improvements in conversion or speed can significantly impact growth.
For enterprise-focused companies, the focus shifts to deal quality and long-term value. Key metrics include:
Average deal size
Win rate by segment
Net revenue retention
Expansion revenue
Deal slippage rate
In enterprise sales, closing the deal is only part of the process. Strong customer success and high customer satisfaction are essential for retaining large accounts and driving long-term revenue. This makes retention and expansion metrics just as important as initial conversion.
Avoiding vanity metrics
One of the most common mistakes is tracking metrics that don’t impact outcomes.
Examples include:
Number of leads without conversion
Pipeline size without quality
Activity without revenue impact
Instead, companies should focus on key metrics that directly influence revenue:
Conversion rates
Retention
Expansion
Metrics should reflect real performance, not just activity.
A good rule is simple. If a metric doesn’t help improve decisions or outcomes, it probably shouldn’t be tracked.
How to Build a Revenue Operations Metrics Framework
A strong metrics framework helps turn data into consistent decisions. It ensures that teams track the same numbers, understand them in the same way, and use them to improve performance. Without a clear structure, even the best metrics won’t drive results or support sustainable growth.
Define your revenue model
Start by clearly defining how your business generates revenue. This includes understanding your pricing model, deal structure, and how revenue flows through the organization.
For example, companies with recurring revenue models should focus more on retention, expansion, and customer lifetime value. Businesses with transactional sales may prioritize customer acquisition cost and deal volume.
Your revenue model determines which revenue metrics matter most. It also helps align revenue operations professionals around the same logic and expectations.
Map the full funnel (lead → revenue → retention)
Next, map your entire revenue journey. This includes every stage from lead generation to closing deals and retaining customers.
A simple structure:
Lead → Opportunity → Customer → Expansion
Each stage should have clear metrics. For example:
Conversion rates in the sales funnel
Pipeline coverage in the sales pipeline
Retention and expansion driven by customer success teams
This approach helps identify where revenue slows down and where improvements are needed.
Align teams on shared definitions
Metrics only work if everyone understands them the same way. Misalignment between marketing, sales and customer success teams leads to confusion and incorrect reporting.
For example:
What qualifies as a lead?
When is a deal considered closed?
How is churn defined?
Clear definitions ensure that all teams track the same key metrics and work toward shared business goals.
This alignment also improves collaboration between sales, marketing, and customer success functions.
Build dashboards and reporting
Finally, metrics need to be visible and easy to use. Dashboards should focus on the most important numbers and avoid unnecessary complexity.
Effective dashboards:
Highlight key trends
Show performance against targets
Help teams make decisions quickly
Tools like HubSpot provide basic reporting, while platforms like Forecastio add deeper insights into pipeline quality, risks, and sales forecasting.
The goal is not just to track data, but to use it to improve performance and maintain strong customer satisfaction over time.
Tools for Tracking Revenue Operations Metrics
Tracking revenue operations metrics requires the right tools. Without proper systems, data becomes fragmented and hard to use. The goal is to build a single source of truth that supports decision-making across marketing, sales, and customer success.
CRM systems
CRM systems are the foundation of any revenue operations setup. They store data about leads, deals, and paying customers, and track activity across the sales pipeline.
Popular CRM tools:
They are used for:
Managing the sales funnel
Tracking deal progression
Supporting daily work of the sales team
Most CRM systems provide basic sales metrics, but they often lack deeper insights into forecasting and pipeline quality.
BI and analytics tools
BI tools help analyze and visualize data from multiple sources. They are useful for building dashboards and tracking trends across the business.
Popular BI tools:
They allow teams to:
Combine data from marketing, sales, and customer success
Track trends in growth
Build custom dashboards for different teams
However, they require setup and ongoing maintenance, and they depend heavily on clean data.
Revenue intelligence platforms
Revenue intelligence platforms collect and analyze data from across the revenue process, including CRM activity, emails, calls, and deal interactions. They help teams understand what is actually happening behind the numbers and how it impacts outcomes.
They matter because they provide context, not just metrics. Instead of only showing pipeline value or forecasts, they explain why deals move, stall, or close.
Examples include:
These platforms provide:
Forecasting models and accuracy tracking
Pipeline health and risk analysis
Visibility into deal movement and delays
They also support customer success teams by improving visibility into renewals or expansion potential.
Conclusion: Turning RevOps Metrics into Revenue Growth
Revenue operations metrics are only valuable if they lead to action. Tracking data alone doesn't improve results. What matters is how teams use these insights to make better decisions and improve performance.
The most effective companies focus on a small set of key metrics that directly impact outcomes. They align marketing and sales teams with customer success teams, improve customer satisfaction of your customers, supported by indicators like net promoter score, and build systems that support consistent execution. This is what enables more predictable performance and long-term sustainable growth.
In practice, strong revenue operations are not about tracking everything. It's about understanding what drives revenue, identifying weak points in the process, and continuously improving them. This includes everything from customer acquisition to retention and expansion.
Tools like Forecastio help take this further. They don't just track metrics. They help explain what is happening inside the pipeline and how to improve it.
In the end, companies that succeed are those that turn data into decisions and decisions into results.
Share:
Alex is the CEO at Forecastio, bringing over 15 years of experience as a seasoned B2B sales expert and leader in the tech industry. His expertise lies in streamlining sales operations, developing robust go-to-market strategies, enhancing sales planning and forecasting, and refining sales processes.
Alex is the CEO at Forecastio, bringing over 15 years of experience as a seasoned B2B sales expert and leader in the tech industry. His expertise lies in streamlining sales operations, developing robust go-to-market strategies, enhancing sales planning and forecasting, and refining sales processes.
Related articles

Sales Leadership
Mar 31, 2026
5 min

Sales Strategies
Mar 29, 2026
15 min

Pipeline Management
Mar 28, 2026
9 min
Sales Leadership
Mar 31, 2026
5 min
Sales Strategies
Mar 29, 2026
15 min
Sales Leadership
Mar 31, 2026
5 min
Sales Strategies
Mar 29, 2026
15 min
Sales Planning
Sales Forecasting
Sales Performance Insights
Sales Planning
Sales Forecasting
Sales Performance Insights
Sales Planning
Sales Forecasting
Sales Performance Insights


Product
© 2025 Forecastio, All rights reserved.
Sales Planning
Sales Forecasting
Sales Performance Insights
Sales Planning
Sales Forecasting
Sales Performance Insights
Sales Planning
Sales Forecasting
Sales Performance Insights
Product
© 2025 Forecastio, All rights reserved.
Sales Planning
Sales Forecasting
Sales Performance Insights
Sales Planning
Sales Forecasting
Sales Performance Insights
Sales Planning
Sales Forecasting
Sales Performance Insights
Product
© 2025 Forecastio, All rights reserved.