
Sales Forecasting Examples That Actually Work

Alex Zlotko
CEO at Forecastio
Last updated
Reading time
11 min
Get sales forecasting insights with Forecastio

Why Sales Forecasting Is Critical for B2B Success
Sales forecasting is the backbone of strategic business planning. An accurate sales forecast empowers sales leaders to predict future revenue, allocate resources efficiently, and make confident, data-driven decisions. The ability to forecast sales reliably isn't just about generating reports—it's a strategic asset that directly impacts your company's growth and profitability.
According to Gartner research, companies that can forecast within 10% of actual results are more than twice as likely to experience consistent growth year-over-year. This clearly demonstrates why sales forecasting is so important—it gives your organization the clarity needed to navigate changing market conditions, anticipate demand, and optimize your sales strategy.
Most sales forecasts are based on past sales performances as well as current pipeline data, but what separates great forecasting from mediocre efforts is the methodology and consistency applied to the process. Whether using historical trend analysis, pipeline stage probabilities, or advanced AI-driven models, a structured approach to forecasting sales helps you stay aligned with business objectives while adjusting to external factors that influence projected sales. For instance, reviewing a sales forecast example can highlight how assumptions and data inputs shape results. Similarly, a sales forecast example for new business provides valuable insight into how startups and growing companies can plan realistically even without extensive historical data. For companies looking to align forecasting with pricing strategy, check out this Guide to Repricing Software.
Complete Sales Forecast Example for a B2B SaaS Company

How to Read This Sales Forecast Example
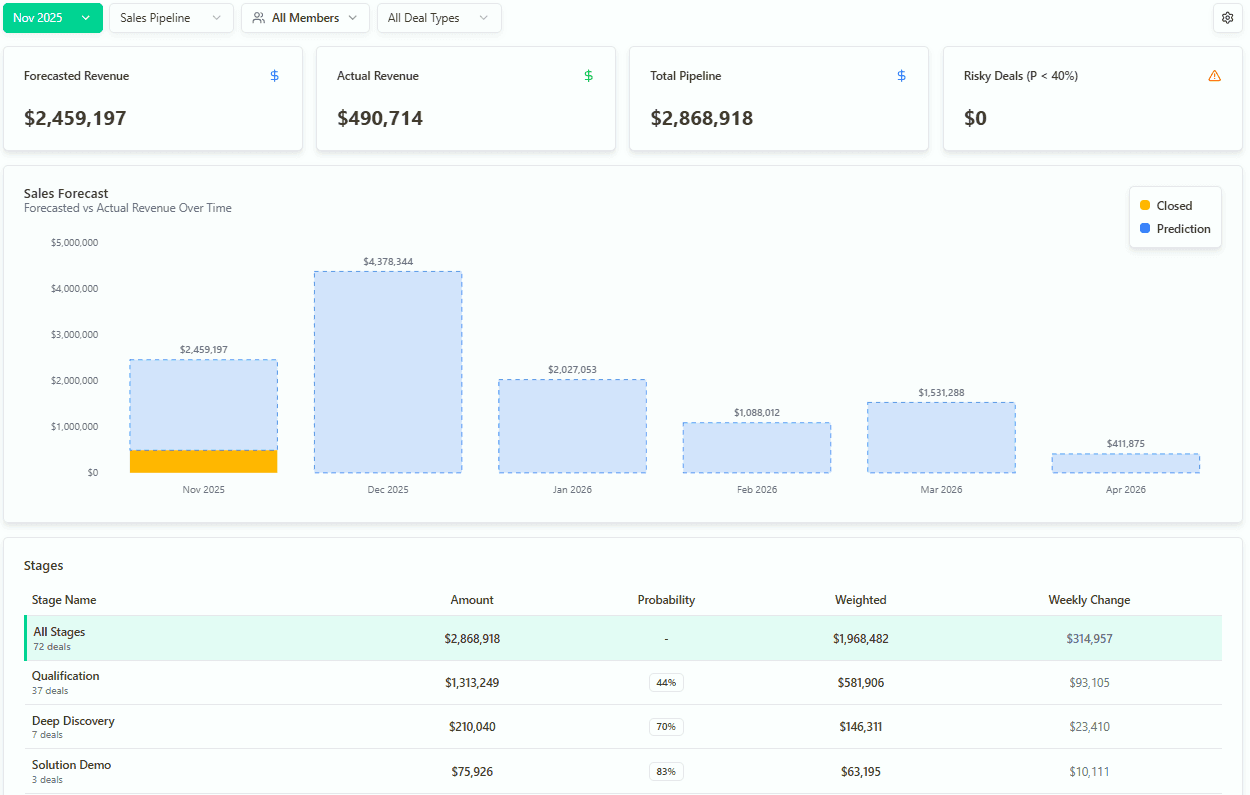
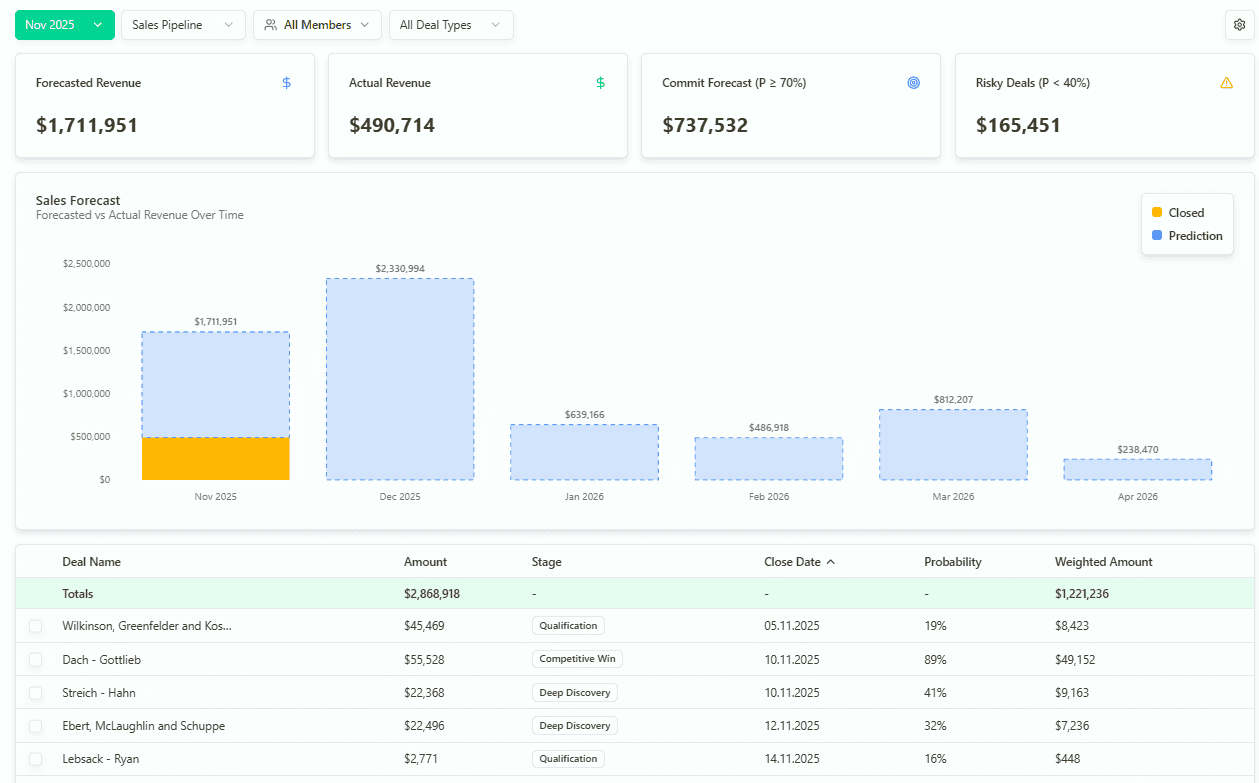
This example shows how many modern B2B sales teams build revenue forecasts by combining multiple forecasting methods instead of relying on a single number.
Each sales rep starts by estimating how much revenue they expect to close during the period. At the same time, the AI Forecast analyzes every open opportunity using historical win rates, deal progression, pipeline trends, and other signals to estimate expected revenue more objectively.
Sales leaders then review both forecasts together. They consider qualitative information that may not yet be reflected in CRM data, such as executive relationships, procurement delays, legal reviews, or recent customer conversations. Based on this review, they create the Management Forecast, which becomes the team's official forecast.
Finally, the forecast is compared against the team's revenue target. The Gap to Target shows whether the team is currently on track to hit quota or whether additional pipeline generation or deal acceleration is needed before the end of the period.
This approach combines the strengths of human judgment and AI predictions, resulting in more accurate and more actionable sales forecasts.
How do you predict sales growth?
Predicting sales growth requires a balance between analyzing historical performance and applying forward-looking models. Businesses use past sales data, current pipeline health, and market trends to estimate how much revenue they will generate in the coming months or quarters. By creating detailed forecasts, sales leaders can allocate resources effectively, set realistic targets, and prepare strategies that respond to changing market conditions. Below are two common approaches that illustrate this process.
Monthly sales forecast example
A monthly sales forecast example breaks down projected sales into 30-day cycles, giving managers a clear picture of short-term performance. This approach is useful for identifying seasonality, understanding sales team productivity, and spotting trends that can affect future months. For instance, if a company notices declining conversion rates in one month, it can immediately take corrective actions to improve the next period’s results. Monthly forecasts provide agility and allow businesses to react quickly rather than waiting until quarterly reviews.
Revenue forecast example
A revenue forecast example goes one step further by showing how predicted sales figures translate into overall business income. It connects sales activity directly with financial outcomes, helping leaders make informed decisions about budgeting, hiring, and investments. Revenue forecasts are especially important for aligning sales goals with broader organizational objectives. By combining pipeline analysis, average deal size, and win rates, businesses can build revenue models that highlight not only expected income but also potential risks and growth opportunities.
Why Do Companies Fail to Forecast Sales Accurately?
Despite understanding the importance of sales forecasting, many organizations struggle to deliver accurate and actionable forecasts. The problem isn't the concept of forecasting itself—it's how the sales forecasting process is executed. Here are the most common reasons sales forecasts fail:
Overreliance on intuition: Sales reps often rely on gut feelings rather than data-driven sales forecasting methods. While intuitive forecasting feels comfortable, it rarely produces an accurate sales forecast without solid historical data and performance metrics.
Poor data quality: Outdated or incomplete sales data inevitably skews forecasts. Without clean, current information from your sales pipeline, you can't reliably predict future sales or estimate revenue.
Inconsistent CRM hygiene: When your team doesn't maintain consistent deal stages or follow a clearly defined sales process, it becomes nearly impossible to forecast with precision. Sales forecasting tools only work when the underlying data is trustworthy.
One-size-fits-all approach: Using the same forecasting method across different sales motions—like applying a model built for enterprise sales to a high-velocity team—leads to misaligned projections and inaccurate estimates.
Lack of deal-level risk assessment: Without accounting for stalled opportunities, deals stuck in the sales cycle, or single-threaded conversations, sales forecasts become overly optimistic and unreliable.
To create a sales forecast that actually drives decisions, you need to choose the right sales forecasting method, ensure clean data, and maintain a disciplined process that reflects your market conditions and sales strategy.
7 Powerful Sales Forecasting Examples With Real Numbers
1. Opportunity Stage Forecasting
This fundamental sales forecasting method uses your pipeline stages to generate reliable projections. Each stage in the sales cycle — such as Discovery, Demo, Proposal, and Contract— is assigned a probability based on historical conversion rates. These probabilities are then applied to active deals to forecast revenue.
Example of a sales forecast using stage probabilities:
Step 1: Calculate stage probabilities based on historical data
Stage | Deals Entered | Deals Won | Conversion Rate |
|---|---|---|---|
Discovery | 100 | 20 | 20% |
Demo | 80 | 32 | 40% |
Proposal | 50 | 30 | 60% |
Contract | 30 | 24 | 80% |
Formula: Probability = Deals Won ÷ Deals Entered
Step 2: Apply probabilities to current pipeline
Deal | Stage | Deal Value | Stage Probability | Weighted Forecast |
|---|---|---|---|---|
Deal A | Proposal | $20,000 | 60% | $12,000 |
Deal B | Demo | $10,000 | 40% | $4,000 |
Deal C | Discovery | $15,000 | 20% | $3,000 |
Total Forecast = $19,000
This sales forecasting example works best when you have:
Clearly defined pipeline stages
Reliable historical sales data
A relatively stable sales cycle
Pros:
Simple and intuitive methodology
Doesn't require advanced forecasting software
Works well when historical performance is consistent
Cons:
May overlook deal quality or sales rep behavior
Doesn't account for stalled deals
Can be skewed if historical data is unreliable
With opportunity stage forecasting, recalibration is an important step. It means reviewing how far your previous forecasts were from actual results and adjusting the model to account for that error. Without recalibration, even the best sales forecasting examples start drifting over time because the model continues making the same mistakes. A simple example is comparing last quarter's predicted revenue with actual revenue and then applying that correction factor to the next forecast.
Opportunity Stage Forecasting with Forecastio
2. Advanced Stage Forecasting with Time-in-Stage Analysis
This more sophisticated forecasting example builds upon traditional stage forecasting by incorporating time spent in each stage. Deals that are stuck or spend significantly longer than average in a stage have their probabilities discounted—making your sales forecast more realistic.
Forecasting example with time-in-stage adjustments:
Step 1: Determine average time in each stage
Stage | Avg Time in Stage |
|---|---|
Discovery | 5 days |
Demo | 7 days |
Proposal | 10 days |
Step 2: Apply discount rule
If time in stage > 150% of average: Reduce probability by 50%
Step 3: Calculate adjusted forecast
Deal | Stage | Deal Value | Standard Probability | Time in Stage | Adjusted Probability | Weighted Forecast |
|---|---|---|---|---|---|---|
Deal A | Proposal | $25,000 | 60% | 20 days (2× avg) | 30% | $7,500 |
Deal B | Demo | $10,000 | 40% | 7 days (on track) | 40% | $4,000 |
Total Forecast = $11,500
This advanced sales projection example gives sales leaders a clearer view of at-risk deals and prevents inflated forecasts caused by pipeline stagnation.
When to use this method:
When you want to reduce the risk of overforecasting
For sales cycles where deals frequently stall
To predict sales with greater precision by factoring in velocity
3. Historical Trend Analysis Forecasting
Historical forecasting uses past sales data from previous periods to predict future performance. This approach assumes that sales follows consistent patterns over time, making it especially useful for companies with clear seasonality or repeatable business cycles.
Projected sales example based on historical data:
Period | Bookings | Growth Rate |
|---|---|---|
Q2 2023 | $100,000 | - |
Q2 2024 | $120,000 | +20% |
Q2 2025 (projected) | $144,000 | +20% (forecast) |
This sales forecasting example is based purely on past trends and assumes that your sales strategy, team structure, and market conditions remain relatively stable.
Best used when:
Your business has steady, predictable sales cycles
Seasonality and trends are reliable indicators
You need a quick, top-level forecast as a baseline
While simple, historical forecasting plays an important role in validating more complex forecasting models and providing a reality check against pipeline-based projections.
4. Machine Learning Probability Forecasting
This advanced sales forecasting method uses AI to calculate win probabilities for each deal based on dozens of variables. Unlike traditional models that rely on static stage probabilities, machine learning analyzes complex patterns in historical data to predict future sales with remarkable accuracy.
Example of forecasting with machine learning
ML models analyze factors including:
Current pipeline stage
Time in stage and total deal age
Deal value and complexity
Industry and company size
Customer engagement metrics
Sales rep activities and skill level
Previous interactions history
Lead source quality
Competitive situation
Sample ML-generated forecast:
Deal | Value | ML-Calculated Probability | Weighted Forecast |
|---|---|---|---|
Deal A | $50,000 | 35% | $17,500 |
Deal B | $30,000 | 70% | $21,000 |
Deal C | $40,000 | 15% | $6,000 |
Total Forecast = $44,500
This example of sales forecasting offers a far more nuanced and responsive view of future revenue than traditional methods. Machine learning sales forecasting models can identify patterns and relationships that human analysis might miss.
When to use ML-based forecasting:
Your CRM contains rich, clean historical data
You have sufficient deal volume for model training
You want to improve forecasting accuracy and reduce bias
You're ready to invest in sales forecasting software
This is one of the most powerful and scalable forecasting examples, giving sales leaders a reliable way to predict future sales with unprecedented precision.
Machine learning takes forecasting a step further. A strong model should estimate two separate probabilities: the overall probability of winning the deal and the most likely month it will close. This makes ML-based sales forecasting much more useful, because you understand both “if” and “when.” Traditional methods typically provide only a single probability, which limits how accurate a this sales forecast example can be.
AI Sales Forecasting with Forecastio
5. Sales Cycle Length Forecasting
This sales forecasting method uses the length of your sales cycle to estimate deal probabilities. Instead of focusing solely on pipeline stages, it evaluates where each deal stands relative to your average cycle length. The further along a deal is, the higher its predicted probability of closing.
Example of cycle-based forecasting:
Step 1: Determine your average sales cycle length
Average cycle = 60 days
Step 2: Calculate probabilities based on progress
Formula: Probability = Days in Cycle ÷ Average Cycle Length
Step 3: Apply to active deals
Deal | Deal Value | Days in Cycle | Avg Sales Cycle | Probability | Weighted Forecast |
|---|---|---|---|---|---|
Deal A | $40,000 | 30 days | 60 days | 50% | $20,000 |
Deal B | $20,000 | 15 days | 60 days | 25% | $5,000 |
Total Forecast = $25,000
This method helps sales teams quickly forecast without requiring deep insights into customer engagement or deal quality. It's particularly effective for companies with high-volume, transactional sales models.
Best suited for:
High deal volume with consistent cycle durations
Teams following a uniform sales process
Quick, high-level sales projections for resource planning
6. Weighted Pipeline Forecast with Calibration
This approach is used when a team already applies a weighted pipeline forecast but wants to correct systematic forecasting bias based on historical performance. It’s especially useful for teams that consistently over-forecast or under-forecast revenue.
Step 1: Standard weighted pipeline forecast
Assume the current pipeline looks like this:
Deal | Deal Value | Stage Probability | Weighted Value |
Deal A | $100,000 | 40% | $40,000 |
Deal B | $80,000 | 60% | $48,000 |
Deal C | $120,000 | 80% | $96,000 |
Weighted pipeline forecast:
$40,000 + $48,000 + $96,000 = $184,000
Step 2: Analyze historical forecast accuracy
Looking at the last 6 months, the team sees the following pattern:
Average weighted pipeline forecast: $200,000
Average actual closed-won revenue: $160,000
This means the team historically over-forecasts by 25%.
Calibration factor:
$160,000 ÷ $200,000 = 0.8
Step 3: Apply calibration to the current forecast
Apply the calibration factor to the weighted pipeline forecast:
$184,000 × 0.8 = $147,200
Final calibrated forecast
Uncalibrated weighted forecast: $184,000
Calibrated forecast: $147,200
This calibrated forecast reflects real historical performance, not just pipeline probabilities.
7. Forecast Categories and Submissions
Unlike probability-based models, forecast categories rely on structured rep judgment. Sales managers ask reps to submit expected revenue based on predefined forecast categories such as Commit, Best Case, and Pipeline.
This approach is widely used in enterprise sales and works best when teams follow a clear submission cadence.
Let's look at a practical sales forecast example.
Scenario
A sales team has 5 open deals closing this quarter:
Deal | Deal Amount | Forecast Category | Submission Probability | Expected Revenue |
|---|---|---|---|---|
A | $50,000 | Commit | 90% | $45,000 |
B | $40,000 | Commit | 90% | $36,000 |
C | $30,000 | Best Case | 60% | $18,000 |
D | $20,000 | Best Case | 60% | $12,000 |
E | $25,000 | Pipeline | 30% | $7,500 |
Total pipeline value: $165,000
Now let's calculate forecast submissions.
Commit Forecast
Only deals in the Commit category are included.
$50,000 + $40,000 = $90,000 Commit forecast
Commit + Best Case Forecast
$90,000 + $30,000 + $20,000 = $140,000 extended forecast
Probability-Weighted Submission View
If we apply structured category probabilities:
Commit (90%)
Best Case (60%)
Pipeline (30%)
Total expected revenue:
$45,000 + $36,000 + $18,000 + $12,000 + $7,500 = $118,500
Why This Method Works
Forecast categories create accountability. Reps must classify deals based on confidence, not just stage.
Forecast submissions allow sales leaders to compare:
What reps commit to
What the extended forecast looks like
What the probability-weighted number shows
If the Commit number constantly misses target, it signals weak qualification or deal slippage. If Best Case consistently converts to Commit, it may indicate conservative rep behavior.
This type of sales forecast example shows how forecast categories combine structured judgment with measurable discipline.
When to Use Different Sales Forecasting Methods
Different sales forecasting methods work better for different sales models, pipeline structures, and levels of CRM maturity. Choosing the right approach depends on your sales cycle, deal volume, data quality, and forecasting goals.
Opportunity stage forecasting works best for teams with clearly defined pipeline stages and stable historical conversion rates.
Advanced stage forecasting with time-in-stage analysis is useful when deals frequently stall or slip between forecast periods.
Historical trend forecasting is effective for businesses with predictable seasonality and stable revenue patterns.
Machine learning forecasting works best for B2B companies with strong CRM discipline, large pipelines, and enough historical data to train AI models.
Sales cycle forecasting is useful for high-volume transactional sales environments with repeatable sales motions.
Weighted pipeline forecasting with calibration helps teams adjust projections based on historical forecasting errors.
Forecast categories and submissions are especially valuable in enterprise sales environments where management judgment and rep accountability play a major role.
In practice, many organizations combine several sales forecasting methods to create more reliable and balanced revenue projections.
How to Choose the Right Sales Forecasting Method
There's no universal approach to building an accurate sales forecast—the best method depends on your specific business model, team structure, and data maturity. To forecast sales effectively, consider these key factors:
1. Your Sales Motion
Is your team closing high-velocity deals or navigating complex enterprise sales?
High-velocity sales: Consider stage-based or cycle-length forecasting
Enterprise sales: Use machine learning or advanced stage forecasting that accounts for multiple risk factors
2. Data Availability and Quality
How much historical data do you have, and how reliable is it?
Clean, extensive data: Leverage sophisticated sales forecasting tools that analyze multiple variables
Limited or inconsistent data: Start simple with historical or basic stage forecasting
3. Team Size and CRM Discipline
Are you a small team or a mature organization with RevOps support?
Small team, simple process: Begin with classic stage-based forecasting
Larger team, good CRM hygiene: Move toward AI-based forecasting or hybrid models
Mixed organization: Combine multiple methods for a blended view of future revenue
Improving Your Sales Forecasting Accuracy
Enhancing your sales forecasting accuracy doesn't require completely overhauling your process. Instead, focus on these practical steps:
Audit your CRM data: Standardize fields, define pipeline stages clearly, and maintain clean data
Analyze past forecast accuracy: Compare predictions to actual results by rep, team, and method
Segment your pipeline: Separate enterprise from high-velocity deals—each requires its own approach
Use multiple models: Blend historical, stage-based, and AI-driven forecasts for greater reliability
Review weekly: Make forecasting a routine part of your sales process, not just a monthly task
Factor in deal-level risk: Flag and discount stalled, single-threaded, or aging deals
Invest in forecasting tools: Platforms like Forecastio automate complex calculations and help sales leaders make faster, data-driven decisions
Why Close Date Accuracy Matters in Every Forecast
Across all sales forecasting examples, one factor consistently impacts accuracy more than most teams expect: close dates.
Even when deal probabilities are correct, inaccurate close dates shift revenue between periods and distort the forecast. A deal expected to close this quarter but slipping into the next one doesn't just reduce accuracy. It creates false confidence in current performance.
For example:
A pipeline may show $500,000 in forecasted revenue
If 20–30% of those deals slip to the next period, actual results can fall significantly below expectations
This is why strong forecasting models don't rely only on probability. They also reflect realistic timing.
To improve forecast reliability:
Track how often close dates change
Measure forecast accuracy by period, not just overall
Identify deals that repeatedly move forward in time
Align expected close dates with real sales cycle patterns
Close dates are not just a field in CRM. They are one of the most important drivers of whether a sales forecast example reflects reality or optimism.
External Factors That Influence a Sales Forecast
A comprehensive sales forecast must account for various external factors that can significantly impact results. When building your forecast model, be sure to consider:
Economic conditions: Overall economic health, inflation rates, and industry-specific economic indicators
Seasonality: Recurring patterns of demand fluctuation throughout the year
Market trends: Emerging technologies, shifting customer preferences, and industry disruptions
Competitive landscape: New competitors, pricing changes, or product launches from existing rivals
Regulatory changes: New laws or regulations that could affect your products or target markets
Supply chain factors: Availability of materials, shipping delays, or cost fluctuations
Political environment: Elections, policy changes, or international relations that might impact business
List external factors that influence a sales forecast to ensure your projections account for all variables beyond your control. Adjusting for these factors will help you develop more accurate, resilient forecasts.
Summary: Making Sales Forecasting Work for Your Business
Sales forecasting is both art and science. From simple stage-based projections to advanced AI-powered models, each sales forecasting method offers unique advantages. The key is selecting the right approach based on your sales motion, data quality, and business objectives.
Most importantly, treat sales forecasting as a dynamic, ongoing process—not just a quarterly spreadsheet exercise. Regular updates, better inputs, and continuous learning will drive more accurate forecasts over time. This disciplined approach to forecasting ensures you aren't just predicting future sales—you're actively shaping how you lead, plan, and scale your business with confidence.
Ready to transform your sales forecasting process? Book a demo to see how Forecastio's advanced forecasting platform can help you achieve unprecedented accuracy and make data-driven decisions that drive growth.
FAQs About Sales Forecasting
What is the formula for predicting sales?
The most common formula for predicting sales is: Forecasted Sales = (Deal Value × Probability of Closing). However, advanced forecasting methods incorporate multiple variables including historical trends, pipeline metrics, and external factors for greater accuracy.
Which type of sales forecasting is based on the analysis of hard facts or numerical data?
Quantitative sales forecasting methods like historical analysis, regression, and pipeline-based modeling rely on numerical data rather than subjective judgment. These methods use statistical techniques to analyze past performance and current pipeline data to predict future sales.
Why do some businesses fail to forecast sales?
Businesses fail to forecast sales accurately due to poor data quality, inconsistent processes, over-reliance on intuition rather than metrics, inadequate tools, and failure to account for external market factors. Successful forecasting requires clean data, consistent methodology, and regular review.
What are the 5 machine learning techniques for sales forecasting?
The five primary machine learning techniques for sales forecasting are:
Regression analysis (linear/multivariate)
Time series models (ARIMA/SARIMA)
Random forest algorithms
Neural networks (deep learning)
Gradient boosting models
What does a sales forecast look like?
A sales forecast typically appears as a structured report containing projected revenue figures broken down by time period (monthly, quarterly, annual), product line, territory, or sales team. It often includes probability-weighted deal values, historical comparisons, and graphical representations of trends.
Why Sales Forecasting Is Critical for B2B Success
Sales forecasting is the backbone of strategic business planning. An accurate sales forecast empowers sales leaders to predict future revenue, allocate resources efficiently, and make confident, data-driven decisions. The ability to forecast sales reliably isn't just about generating reports—it's a strategic asset that directly impacts your company's growth and profitability.
According to Gartner research, companies that can forecast within 10% of actual results are more than twice as likely to experience consistent growth year-over-year. This clearly demonstrates why sales forecasting is so important—it gives your organization the clarity needed to navigate changing market conditions, anticipate demand, and optimize your sales strategy.
Most sales forecasts are based on past sales performances as well as current pipeline data, but what separates great forecasting from mediocre efforts is the methodology and consistency applied to the process. Whether using historical trend analysis, pipeline stage probabilities, or advanced AI-driven models, a structured approach to forecasting sales helps you stay aligned with business objectives while adjusting to external factors that influence projected sales. For instance, reviewing a sales forecast example can highlight how assumptions and data inputs shape results. Similarly, a sales forecast example for new business provides valuable insight into how startups and growing companies can plan realistically even without extensive historical data. For companies looking to align forecasting with pricing strategy, check out this Guide to Repricing Software.
Complete Sales Forecast Example for a B2B SaaS Company
How to Read This Sales Forecast Example
This example shows how many modern B2B sales teams build revenue forecasts by combining multiple forecasting methods instead of relying on a single number.
Each sales rep starts by estimating how much revenue they expect to close during the period. At the same time, the AI Forecast analyzes every open opportunity using historical win rates, deal progression, pipeline trends, and other signals to estimate expected revenue more objectively.
Sales leaders then review both forecasts together. They consider qualitative information that may not yet be reflected in CRM data, such as executive relationships, procurement delays, legal reviews, or recent customer conversations. Based on this review, they create the Management Forecast, which becomes the team's official forecast.
Finally, the forecast is compared against the team's revenue target. The Gap to Target shows whether the team is currently on track to hit quota or whether additional pipeline generation or deal acceleration is needed before the end of the period.
This approach combines the strengths of human judgment and AI predictions, resulting in more accurate and more actionable sales forecasts.
How do you predict sales growth?
Predicting sales growth requires a balance between analyzing historical performance and applying forward-looking models. Businesses use past sales data, current pipeline health, and market trends to estimate how much revenue they will generate in the coming months or quarters. By creating detailed forecasts, sales leaders can allocate resources effectively, set realistic targets, and prepare strategies that respond to changing market conditions. Below are two common approaches that illustrate this process.
Monthly sales forecast example
A monthly sales forecast example breaks down projected sales into 30-day cycles, giving managers a clear picture of short-term performance. This approach is useful for identifying seasonality, understanding sales team productivity, and spotting trends that can affect future months. For instance, if a company notices declining conversion rates in one month, it can immediately take corrective actions to improve the next period’s results. Monthly forecasts provide agility and allow businesses to react quickly rather than waiting until quarterly reviews.
Revenue forecast example
A revenue forecast example goes one step further by showing how predicted sales figures translate into overall business income. It connects sales activity directly with financial outcomes, helping leaders make informed decisions about budgeting, hiring, and investments. Revenue forecasts are especially important for aligning sales goals with broader organizational objectives. By combining pipeline analysis, average deal size, and win rates, businesses can build revenue models that highlight not only expected income but also potential risks and growth opportunities.
Why Do Companies Fail to Forecast Sales Accurately?
Despite understanding the importance of sales forecasting, many organizations struggle to deliver accurate and actionable forecasts. The problem isn't the concept of forecasting itself—it's how the sales forecasting process is executed. Here are the most common reasons sales forecasts fail:
Overreliance on intuition: Sales reps often rely on gut feelings rather than data-driven sales forecasting methods. While intuitive forecasting feels comfortable, it rarely produces an accurate sales forecast without solid historical data and performance metrics.
Poor data quality: Outdated or incomplete sales data inevitably skews forecasts. Without clean, current information from your sales pipeline, you can't reliably predict future sales or estimate revenue.
Inconsistent CRM hygiene: When your team doesn't maintain consistent deal stages or follow a clearly defined sales process, it becomes nearly impossible to forecast with precision. Sales forecasting tools only work when the underlying data is trustworthy.
One-size-fits-all approach: Using the same forecasting method across different sales motions—like applying a model built for enterprise sales to a high-velocity team—leads to misaligned projections and inaccurate estimates.
Lack of deal-level risk assessment: Without accounting for stalled opportunities, deals stuck in the sales cycle, or single-threaded conversations, sales forecasts become overly optimistic and unreliable.
To create a sales forecast that actually drives decisions, you need to choose the right sales forecasting method, ensure clean data, and maintain a disciplined process that reflects your market conditions and sales strategy.
7 Powerful Sales Forecasting Examples With Real Numbers
1. Opportunity Stage Forecasting
This fundamental sales forecasting method uses your pipeline stages to generate reliable projections. Each stage in the sales cycle — such as Discovery, Demo, Proposal, and Contract— is assigned a probability based on historical conversion rates. These probabilities are then applied to active deals to forecast revenue.
Example of a sales forecast using stage probabilities:
Step 1: Calculate stage probabilities based on historical data
Stage | Deals Entered | Deals Won | Conversion Rate |
|---|---|---|---|
Discovery | 100 | 20 | 20% |
Demo | 80 | 32 | 40% |
Proposal | 50 | 30 | 60% |
Contract | 30 | 24 | 80% |
Formula: Probability = Deals Won ÷ Deals Entered
Step 2: Apply probabilities to current pipeline
Deal | Stage | Deal Value | Stage Probability | Weighted Forecast |
|---|---|---|---|---|
Deal A | Proposal | $20,000 | 60% | $12,000 |
Deal B | Demo | $10,000 | 40% | $4,000 |
Deal C | Discovery | $15,000 | 20% | $3,000 |
Total Forecast = $19,000
This sales forecasting example works best when you have:
Clearly defined pipeline stages
Reliable historical sales data
A relatively stable sales cycle
Pros:
Simple and intuitive methodology
Doesn't require advanced forecasting software
Works well when historical performance is consistent
Cons:
May overlook deal quality or sales rep behavior
Doesn't account for stalled deals
Can be skewed if historical data is unreliable
With opportunity stage forecasting, recalibration is an important step. It means reviewing how far your previous forecasts were from actual results and adjusting the model to account for that error. Without recalibration, even the best sales forecasting examples start drifting over time because the model continues making the same mistakes. A simple example is comparing last quarter's predicted revenue with actual revenue and then applying that correction factor to the next forecast.
Opportunity Stage Forecasting with Forecastio
2. Advanced Stage Forecasting with Time-in-Stage Analysis
This more sophisticated forecasting example builds upon traditional stage forecasting by incorporating time spent in each stage. Deals that are stuck or spend significantly longer than average in a stage have their probabilities discounted—making your sales forecast more realistic.
Forecasting example with time-in-stage adjustments:
Step 1: Determine average time in each stage
Stage | Avg Time in Stage |
|---|---|
Discovery | 5 days |
Demo | 7 days |
Proposal | 10 days |
Step 2: Apply discount rule
If time in stage > 150% of average: Reduce probability by 50%
Step 3: Calculate adjusted forecast
Deal | Stage | Deal Value | Standard Probability | Time in Stage | Adjusted Probability | Weighted Forecast |
|---|---|---|---|---|---|---|
Deal A | Proposal | $25,000 | 60% | 20 days (2× avg) | 30% | $7,500 |
Deal B | Demo | $10,000 | 40% | 7 days (on track) | 40% | $4,000 |
Total Forecast = $11,500
This advanced sales projection example gives sales leaders a clearer view of at-risk deals and prevents inflated forecasts caused by pipeline stagnation.
When to use this method:
When you want to reduce the risk of overforecasting
For sales cycles where deals frequently stall
To predict sales with greater precision by factoring in velocity
3. Historical Trend Analysis Forecasting
Historical forecasting uses past sales data from previous periods to predict future performance. This approach assumes that sales follows consistent patterns over time, making it especially useful for companies with clear seasonality or repeatable business cycles.
Projected sales example based on historical data:
Period | Bookings | Growth Rate |
|---|---|---|
Q2 2023 | $100,000 | - |
Q2 2024 | $120,000 | +20% |
Q2 2025 (projected) | $144,000 | +20% (forecast) |
This sales forecasting example is based purely on past trends and assumes that your sales strategy, team structure, and market conditions remain relatively stable.
Best used when:
Your business has steady, predictable sales cycles
Seasonality and trends are reliable indicators
You need a quick, top-level forecast as a baseline
While simple, historical forecasting plays an important role in validating more complex forecasting models and providing a reality check against pipeline-based projections.
4. Machine Learning Probability Forecasting
This advanced sales forecasting method uses AI to calculate win probabilities for each deal based on dozens of variables. Unlike traditional models that rely on static stage probabilities, machine learning analyzes complex patterns in historical data to predict future sales with remarkable accuracy.
Example of forecasting with machine learning
ML models analyze factors including:
Current pipeline stage
Time in stage and total deal age
Deal value and complexity
Industry and company size
Customer engagement metrics
Sales rep activities and skill level
Previous interactions history
Lead source quality
Competitive situation
Sample ML-generated forecast:
Deal | Value | ML-Calculated Probability | Weighted Forecast |
|---|---|---|---|
Deal A | $50,000 | 35% | $17,500 |
Deal B | $30,000 | 70% | $21,000 |
Deal C | $40,000 | 15% | $6,000 |
Total Forecast = $44,500
This example of sales forecasting offers a far more nuanced and responsive view of future revenue than traditional methods. Machine learning sales forecasting models can identify patterns and relationships that human analysis might miss.
When to use ML-based forecasting:
Your CRM contains rich, clean historical data
You have sufficient deal volume for model training
You want to improve forecasting accuracy and reduce bias
You're ready to invest in sales forecasting software
This is one of the most powerful and scalable forecasting examples, giving sales leaders a reliable way to predict future sales with unprecedented precision.
Machine learning takes forecasting a step further. A strong model should estimate two separate probabilities: the overall probability of winning the deal and the most likely month it will close. This makes ML-based sales forecasting much more useful, because you understand both “if” and “when.” Traditional methods typically provide only a single probability, which limits how accurate a this sales forecast example can be.
AI Sales Forecasting with Forecastio
5. Sales Cycle Length Forecasting
This sales forecasting method uses the length of your sales cycle to estimate deal probabilities. Instead of focusing solely on pipeline stages, it evaluates where each deal stands relative to your average cycle length. The further along a deal is, the higher its predicted probability of closing.
Example of cycle-based forecasting:
Step 1: Determine your average sales cycle length
Average cycle = 60 days
Step 2: Calculate probabilities based on progress
Formula: Probability = Days in Cycle ÷ Average Cycle Length
Step 3: Apply to active deals
Deal | Deal Value | Days in Cycle | Avg Sales Cycle | Probability | Weighted Forecast |
|---|---|---|---|---|---|
Deal A | $40,000 | 30 days | 60 days | 50% | $20,000 |
Deal B | $20,000 | 15 days | 60 days | 25% | $5,000 |
Total Forecast = $25,000
This method helps sales teams quickly forecast without requiring deep insights into customer engagement or deal quality. It's particularly effective for companies with high-volume, transactional sales models.
Best suited for:
High deal volume with consistent cycle durations
Teams following a uniform sales process
Quick, high-level sales projections for resource planning
6. Weighted Pipeline Forecast with Calibration
This approach is used when a team already applies a weighted pipeline forecast but wants to correct systematic forecasting bias based on historical performance. It’s especially useful for teams that consistently over-forecast or under-forecast revenue.
Step 1: Standard weighted pipeline forecast
Assume the current pipeline looks like this:
Deal | Deal Value | Stage Probability | Weighted Value |
Deal A | $100,000 | 40% | $40,000 |
Deal B | $80,000 | 60% | $48,000 |
Deal C | $120,000 | 80% | $96,000 |
Weighted pipeline forecast:
$40,000 + $48,000 + $96,000 = $184,000
Step 2: Analyze historical forecast accuracy
Looking at the last 6 months, the team sees the following pattern:
Average weighted pipeline forecast: $200,000
Average actual closed-won revenue: $160,000
This means the team historically over-forecasts by 25%.
Calibration factor:
$160,000 ÷ $200,000 = 0.8
Step 3: Apply calibration to the current forecast
Apply the calibration factor to the weighted pipeline forecast:
$184,000 × 0.8 = $147,200
Final calibrated forecast
Uncalibrated weighted forecast: $184,000
Calibrated forecast: $147,200
This calibrated forecast reflects real historical performance, not just pipeline probabilities.
7. Forecast Categories and Submissions
Unlike probability-based models, forecast categories rely on structured rep judgment. Sales managers ask reps to submit expected revenue based on predefined forecast categories such as Commit, Best Case, and Pipeline.
This approach is widely used in enterprise sales and works best when teams follow a clear submission cadence.
Let's look at a practical sales forecast example.
Scenario
A sales team has 5 open deals closing this quarter:
Deal | Deal Amount | Forecast Category | Submission Probability | Expected Revenue |
|---|---|---|---|---|
A | $50,000 | Commit | 90% | $45,000 |
B | $40,000 | Commit | 90% | $36,000 |
C | $30,000 | Best Case | 60% | $18,000 |
D | $20,000 | Best Case | 60% | $12,000 |
E | $25,000 | Pipeline | 30% | $7,500 |
Total pipeline value: $165,000
Now let's calculate forecast submissions.
Commit Forecast
Only deals in the Commit category are included.
$50,000 + $40,000 = $90,000 Commit forecast
Commit + Best Case Forecast
$90,000 + $30,000 + $20,000 = $140,000 extended forecast
Probability-Weighted Submission View
If we apply structured category probabilities:
Commit (90%)
Best Case (60%)
Pipeline (30%)
Total expected revenue:
$45,000 + $36,000 + $18,000 + $12,000 + $7,500 = $118,500
Why This Method Works
Forecast categories create accountability. Reps must classify deals based on confidence, not just stage.
Forecast submissions allow sales leaders to compare:
What reps commit to
What the extended forecast looks like
What the probability-weighted number shows
If the Commit number constantly misses target, it signals weak qualification or deal slippage. If Best Case consistently converts to Commit, it may indicate conservative rep behavior.
This type of sales forecast example shows how forecast categories combine structured judgment with measurable discipline.
When to Use Different Sales Forecasting Methods
Different sales forecasting methods work better for different sales models, pipeline structures, and levels of CRM maturity. Choosing the right approach depends on your sales cycle, deal volume, data quality, and forecasting goals.
Opportunity stage forecasting works best for teams with clearly defined pipeline stages and stable historical conversion rates.
Advanced stage forecasting with time-in-stage analysis is useful when deals frequently stall or slip between forecast periods.
Historical trend forecasting is effective for businesses with predictable seasonality and stable revenue patterns.
Machine learning forecasting works best for B2B companies with strong CRM discipline, large pipelines, and enough historical data to train AI models.
Sales cycle forecasting is useful for high-volume transactional sales environments with repeatable sales motions.
Weighted pipeline forecasting with calibration helps teams adjust projections based on historical forecasting errors.
Forecast categories and submissions are especially valuable in enterprise sales environments where management judgment and rep accountability play a major role.
In practice, many organizations combine several sales forecasting methods to create more reliable and balanced revenue projections.
How to Choose the Right Sales Forecasting Method
There's no universal approach to building an accurate sales forecast—the best method depends on your specific business model, team structure, and data maturity. To forecast sales effectively, consider these key factors:
1. Your Sales Motion
Is your team closing high-velocity deals or navigating complex enterprise sales?
High-velocity sales: Consider stage-based or cycle-length forecasting
Enterprise sales: Use machine learning or advanced stage forecasting that accounts for multiple risk factors
2. Data Availability and Quality
How much historical data do you have, and how reliable is it?
Clean, extensive data: Leverage sophisticated sales forecasting tools that analyze multiple variables
Limited or inconsistent data: Start simple with historical or basic stage forecasting
3. Team Size and CRM Discipline
Are you a small team or a mature organization with RevOps support?
Small team, simple process: Begin with classic stage-based forecasting
Larger team, good CRM hygiene: Move toward AI-based forecasting or hybrid models
Mixed organization: Combine multiple methods for a blended view of future revenue
Improving Your Sales Forecasting Accuracy
Enhancing your sales forecasting accuracy doesn't require completely overhauling your process. Instead, focus on these practical steps:
Audit your CRM data: Standardize fields, define pipeline stages clearly, and maintain clean data
Analyze past forecast accuracy: Compare predictions to actual results by rep, team, and method
Segment your pipeline: Separate enterprise from high-velocity deals—each requires its own approach
Use multiple models: Blend historical, stage-based, and AI-driven forecasts for greater reliability
Review weekly: Make forecasting a routine part of your sales process, not just a monthly task
Factor in deal-level risk: Flag and discount stalled, single-threaded, or aging deals
Invest in forecasting tools: Platforms like Forecastio automate complex calculations and help sales leaders make faster, data-driven decisions
Why Close Date Accuracy Matters in Every Forecast
Across all sales forecasting examples, one factor consistently impacts accuracy more than most teams expect: close dates.
Even when deal probabilities are correct, inaccurate close dates shift revenue between periods and distort the forecast. A deal expected to close this quarter but slipping into the next one doesn't just reduce accuracy. It creates false confidence in current performance.
For example:
A pipeline may show $500,000 in forecasted revenue
If 20–30% of those deals slip to the next period, actual results can fall significantly below expectations
This is why strong forecasting models don't rely only on probability. They also reflect realistic timing.
To improve forecast reliability:
Track how often close dates change
Measure forecast accuracy by period, not just overall
Identify deals that repeatedly move forward in time
Align expected close dates with real sales cycle patterns
Close dates are not just a field in CRM. They are one of the most important drivers of whether a sales forecast example reflects reality or optimism.
External Factors That Influence a Sales Forecast
A comprehensive sales forecast must account for various external factors that can significantly impact results. When building your forecast model, be sure to consider:
Economic conditions: Overall economic health, inflation rates, and industry-specific economic indicators
Seasonality: Recurring patterns of demand fluctuation throughout the year
Market trends: Emerging technologies, shifting customer preferences, and industry disruptions
Competitive landscape: New competitors, pricing changes, or product launches from existing rivals
Regulatory changes: New laws or regulations that could affect your products or target markets
Supply chain factors: Availability of materials, shipping delays, or cost fluctuations
Political environment: Elections, policy changes, or international relations that might impact business
List external factors that influence a sales forecast to ensure your projections account for all variables beyond your control. Adjusting for these factors will help you develop more accurate, resilient forecasts.
Summary: Making Sales Forecasting Work for Your Business
Sales forecasting is both art and science. From simple stage-based projections to advanced AI-powered models, each sales forecasting method offers unique advantages. The key is selecting the right approach based on your sales motion, data quality, and business objectives.
Most importantly, treat sales forecasting as a dynamic, ongoing process—not just a quarterly spreadsheet exercise. Regular updates, better inputs, and continuous learning will drive more accurate forecasts over time. This disciplined approach to forecasting ensures you aren't just predicting future sales—you're actively shaping how you lead, plan, and scale your business with confidence.
Ready to transform your sales forecasting process? Book a demo to see how Forecastio's advanced forecasting platform can help you achieve unprecedented accuracy and make data-driven decisions that drive growth.
FAQs About Sales Forecasting
What is the formula for predicting sales?
The most common formula for predicting sales is: Forecasted Sales = (Deal Value × Probability of Closing). However, advanced forecasting methods incorporate multiple variables including historical trends, pipeline metrics, and external factors for greater accuracy.
Which type of sales forecasting is based on the analysis of hard facts or numerical data?
Quantitative sales forecasting methods like historical analysis, regression, and pipeline-based modeling rely on numerical data rather than subjective judgment. These methods use statistical techniques to analyze past performance and current pipeline data to predict future sales.
Why do some businesses fail to forecast sales?
Businesses fail to forecast sales accurately due to poor data quality, inconsistent processes, over-reliance on intuition rather than metrics, inadequate tools, and failure to account for external market factors. Successful forecasting requires clean data, consistent methodology, and regular review.
What are the 5 machine learning techniques for sales forecasting?
The five primary machine learning techniques for sales forecasting are:
Regression analysis (linear/multivariate)
Time series models (ARIMA/SARIMA)
Random forest algorithms
Neural networks (deep learning)
Gradient boosting models
What does a sales forecast look like?
A sales forecast typically appears as a structured report containing projected revenue figures broken down by time period (monthly, quarterly, annual), product line, territory, or sales team. It often includes probability-weighted deal values, historical comparisons, and graphical representations of trends.
Share:
Alex is the CEO at Forecastio, bringing over 15 years of experience as a seasoned B2B sales expert and leader in the tech industry. His expertise lies in streamlining sales operations, developing robust go-to-market strategies, enhancing sales planning and forecasting, and refining sales processes.
Alex is the CEO at Forecastio, bringing over 15 years of experience as a seasoned B2B sales expert and leader in the tech industry. His expertise lies in streamlining sales operations, developing robust go-to-market strategies, enhancing sales planning and forecasting, and refining sales processes.
Related articles

Sales Performance
Jul 9, 2026
5 min

Sales Tools
Jul 9, 2026
15 min

Jul 8, 2026
9 min
Sales Performance
Jul 9, 2026
5 min
Sales Tools
Jul 9, 2026
15 min
Sales Performance
Jul 9, 2026
5 min
Sales Tools
Jul 9, 2026
15 min
Sales Planning
Sales Forecasting
Sales Performance Insights
Sales Planning
Sales Forecasting
Sales Performance Insights
Sales Planning
Sales Forecasting
Sales Performance Insights


Product
© 2025 Forecastio, All rights reserved.
Sales Planning
Sales Forecasting
Sales Performance Insights
Sales Planning
Sales Forecasting
Sales Performance Insights
Sales Planning
Sales Forecasting
Sales Performance Insights
Product
© 2025 Forecastio, All rights reserved.
Sales Planning
Sales Forecasting
Sales Performance Insights
Sales Planning
Sales Forecasting
Sales Performance Insights
Sales Planning
Sales Forecasting
Sales Performance Insights
Product
© 2025 Forecastio, All rights reserved.