
The Full Guide to Sales Pipeline Coverage: Formulas, Benchmarks, Use Cases

Alex Zlotko
CEO at Forecastio
Last updated
Reading time
9 min
Share:
Share
Track pipeline coverage in real-time

Introduction
If you lead a B2B sales team, you’ve likely heard the term pipeline coverage tossed around in meetings, forecast reviews, and boardroom discussions. But how well do you really understand what sales pipeline coverage means — and more importantly, how to measure and use your pipeline coverage ratio efficiently?
Pipeline coverage is a foundational metric in sales management. It tells you whether your current sales pipeline is strong enough to hit your revenue targets.
For clarity, let’s define what is pipeline coverage: it’s the ratio between the total value of deals in your pipeline and your sales target for a specific period. In simple terms, if your team needs $1 million in closed deals and currently has $3 million worth of opportunities in the pipeline, your pipeline coverage ratio is 3x. Understanding this ratio helps sales leaders determine whether they have enough qualified opportunities to meet quota or if they need to increase prospecting efforts.
Knowing how to calculate pipeline coverage accurately requires a structured approach and reliable data. This is where modern pipeline coverage analysis tools like Forecastio make a difference. As a HubSpot-native forecasting solution with 95% accuracy, Forecastio automatically aggregates real-time deal data, identifies gaps, and visualizes coverage trends — allowing leaders to make confident decisions faster. By combining AI forecasts with advanced analytics, businesses can go beyond the basic pipeline coverage ratio definition and gain predictive insights into whether their current pipeline can truly support future growth.
What Is Pipeline Coverage?
Pipeline coverage is a core sales metric that helps sales leaders assess whether their current sales pipeline can support upcoming revenue targets. In simple terms, it shows the ratio between your total pipeline value (i.e., open opportunities) and your sales target for a given period, typically monthly or quarterly.
✅ Sales Pipeline Coverage Formula:
Pipeline Coverage = Total Pipeline Value / Sales Target
This formula helps you measure pipeline coverage efficiently and answer a key question:
“Do we have enough in the pipeline to hit our number?”
Let’s break this down with a basic example:
If your sales team has a current pipeline worth $600,000 and a quarterly sales target of $200,000, your pipeline coverage ratio is:
$600,000 ÷ $200,000 = 3x
That means you have three times the amount of potential revenue needed to hit your goal.
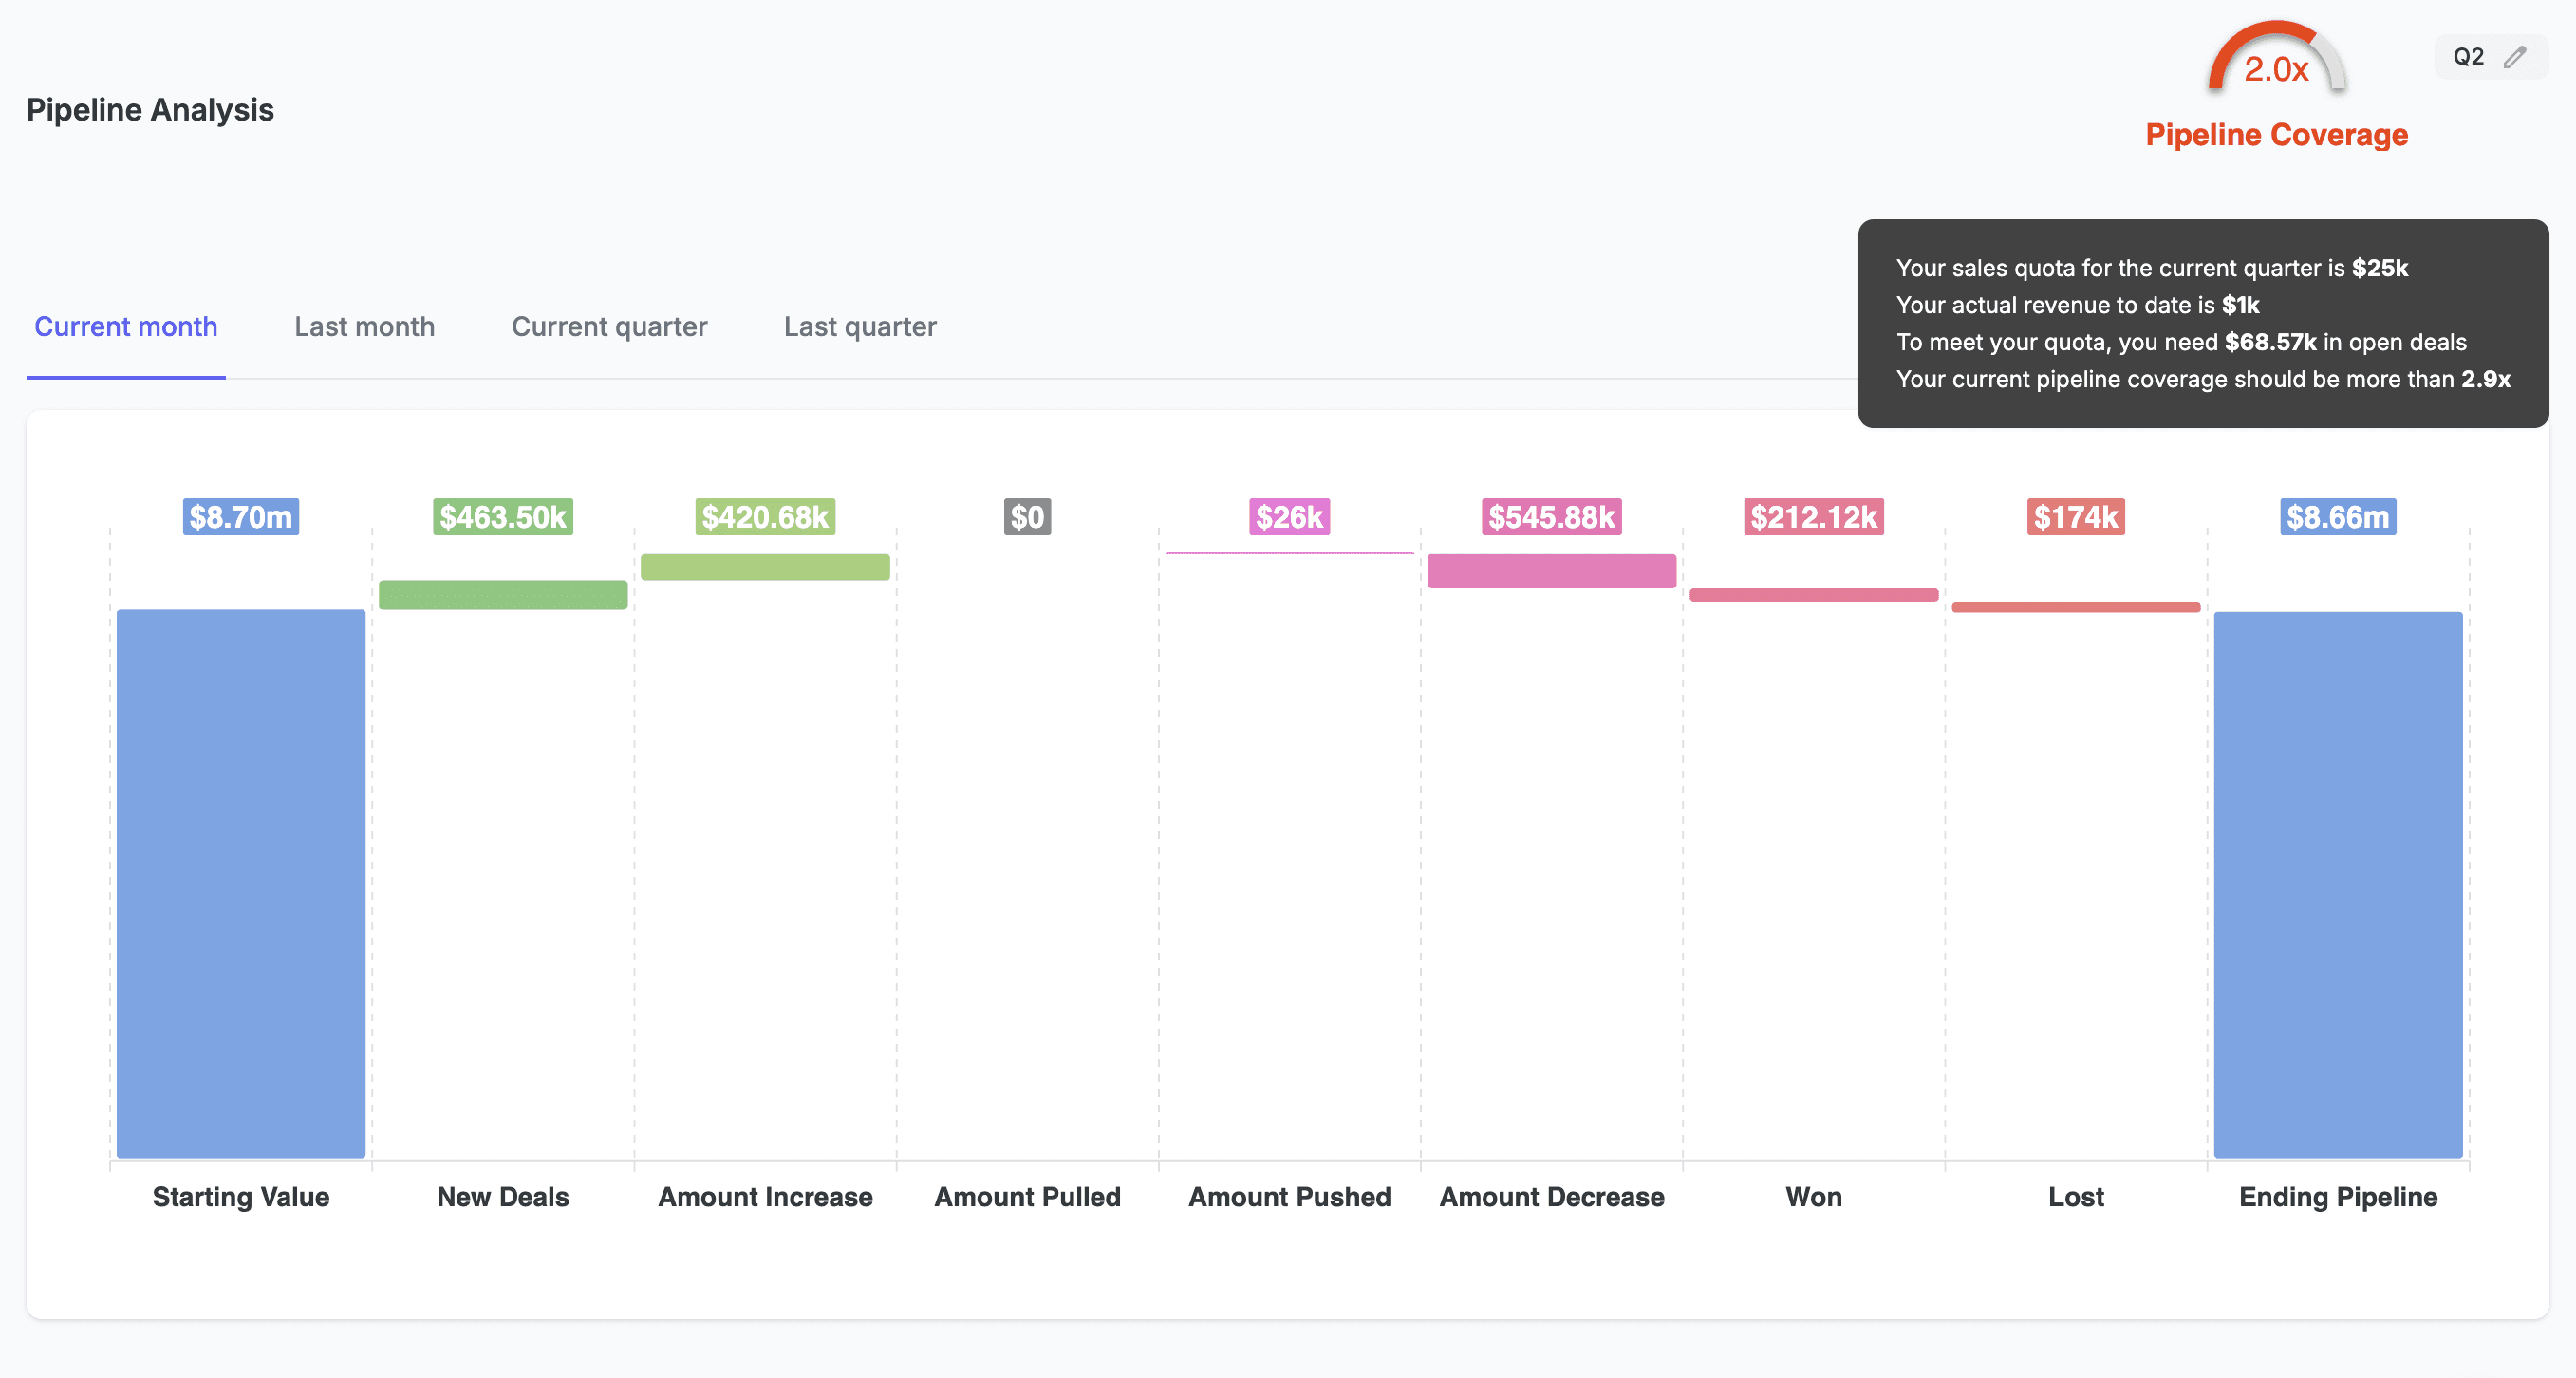
Tracking pipeline coverage in real time with Forecastio
You can also track pipeline coverage at different levels:
Individual rep level: Helps evaluate each rep’s progress toward their quota.
Team or department level: Useful for managing pipeline coverage by region, vertical, or product line.
Company-wide: Helps executives and sales and marketing teams align on how much pipeline generation is needed to hit company-wide revenue goals.
Segmenting your sales pipeline coverage by customer segment, territory, or deal type also allows for better sales forecasting and resource allocation.
💡 Want to avoid spreadsheets and manual math? Forecastio automatically calculates your pipeline coverage ratio across teams, timeframes, and sales reps—helping you build accurate forecasts faster. Book a demo.
Why Pipeline Coverage Matters in B2B Sales
In B2B sales, deals are often long, multi-stakeholder, and unpredictable. That’s why pipeline coverage is more than just a number, it’s a strategic signal. It helps sales leaders quickly assess whether there’s enough pipeline value to support upcoming revenue targets and realistic sales quotas.
A healthy sales pipeline coverage ratio provides early visibility into future performance and allows leaders to take action before it's too late.
Here’s why pipeline coverage is essential:
1. Improves forecast accuracy
Your pipeline coverage and forecast are tightly connected. Without enough pipeline coverage, even the best sales forecasting methods will fail to predict future revenue accurately. If your pipeline coverage ratio is too low, your sales team is at risk of missing quota regardless of how talented they are.
2. Reveals pipeline gaps early
Low pipeline coverage ratio is often the first sign of trouble. By regularly measuring pipeline coverage, leaders can spot gaps in the sales funnel, delayed deals, or missed lead targets and adjust their sales and marketing efforts accordingly.
3. Informs headcount and resource planning
Are there enough opportunities to keep your sales reps productive? Should you invest in more SDRs or marketing campaigns? Understanding how much pipeline coverage you have can help guide critical resourcing decisions, especially in fast-scaling teams.
4. Drives accountability
Tracking pipeline coverage by rep keeps individuals accountable for maintaining a healthy pipeline. It gives sales managers visibility into who is consistently generating enough pipeline value to meet their goals and who might need coaching or support.
📉 Example: Let’s say your team’s average win rate is 25%, and your quarterly revenue target is $400,000.
To hit that number, you’ll need at least $1.6 million in total pipeline value (400,000 ÷ 0.25), meaning your pipeline coverage ratio should be 4x. If your current pipeline is just $800,000 (2x coverage), you’re likely heading for a shortfall unless something changes fast.
How to Calculate Pipeline Coverage
Pipeline coverage is simple to calculate but only if your sales pipeline is clean and your sales targets are clearly defined.
Sales Pipeline Coverage Formula:
Pipeline Coverage = Total Pipeline Value / Sales Target
Steps to Calculate Pipeline Coverage:
Define your time period. Typically monthly or quarterly.
Add up the total value of all open opportunities expected to close in that period.
Divide by your quota or revenue target for the same timeframe.
Example:
Total pipeline value: $1,000,000
Quarterly target: $250,000
Pipeline coverage ratio: 4x
This means you have four times the pipeline value needed to hit your goal—assuming your win rate supports it.

What Is a Good Pipeline Coverage Ratio?
There’s no universal number, but understanding what constitutes a good pipeline coverage ratio is essential for sales forecasting accuracy and smart planning.
Your ideal sales pipeline coverage ratio depends on several factors:
Win rate
Average deal size
Sales cycle length
Historical data and past performance
Still, here are common industry benchmarks to guide your sales strategies:
Sales Type | Typical Pipeline Coverage |
|---|---|
Enterprise Sales | 3x – 5x |
Mid-Market Sales | 2.5x – 4x |
SMB Sales | 2x – 3x |
A healthy pipeline coverage ratio allows your sales team to operate with confidence while still accounting for deal slippage and longer sales cycles.
What Low or High Pipeline Coverage Means
Sales pipeline coverage is a directional metric but it’s not just about hitting a specific number. Whether your pipeline coverage ratio is too low or too high, both situations can signal deeper problems in your sales process, team performance, or forecasting strategy.
Low Pipeline Coverage
If your pipeline coverage is consistently under 2x, it’s a red flag, especially in B2B sales where longer sales cycles and complex deals are the norm.
What low pipeline coverage might mean:
Inadequate pipeline generation from both marketing teams and outbound sales efforts
High deal churn or weak lead qualification processes
Unrealistic quotas that don’t reflect the market or past performance
How to fix it:
Ramp up outbound and demand generation to grow your total value of opportunities
Qualify leads more rigorously to reduce no-decision or lost deals
Measure pipeline coverage by sales rep to identify individual or segment-level gaps
High Pipeline Coverage
On the other hand, an excessively high pipeline coverage ratio isn’t necessarily good news. It can give sales leaders a false sense of security.
What high pipeline coverage might indicate:
A bloated sales pipeline filled with low-probability or stalled deals
Reps padding the pipeline with unqualified opportunities to appear active
Lack of consistent deal qualification and pipeline hygiene
Best Practices:
Prioritize deal quality over volume
Monitor stage-by-stage conversion rates to spot friction in the sales funnel
Use deal aging reports and scoring models to eliminate stale or dead deals
Challenges of Using Pipeline Coverage as a Metric
While pipeline coverage is a valuable and widely used metric in B2B sales, it’s not without its limitations. It provides a quick directional snapshot of whether your sales pipeline can support your sales targets but it doesn't tell the whole story.
✅ Pros of Using Pipeline Coverage:
Simple and fast to calculate with a clear sales pipeline coverage formula
Offers directional insight into quota coverage
Useful for early-stage sales planning and pipeline generation tracking
⚠️ Cons and Limitations:
Doesn’t reflect deal quality or potential revenue
Easy to manipulate by logging unqualified leads as deals
A static snapshot that doesn’t factor in deal velocity, aging, or sales cycle length
Misleading when used in isolation without context like win rate or forecast accuracy
To manage pipeline coverage effectively and avoid misinterpretation, you should always pair it with complementary metrics:
📊 Always Combine Pipeline Coverage With:
Win rate trends: Are you actually closing the amount your coverage suggests?
Deal velocity: How fast are deals moving through your sales funnel?
Forecast accuracy: Does your pipeline coverage align with real outcomes?
Stage progression: Are deals advancing—or just sitting idle?
“A 5x coverage with low win rates and zero movement isn’t better than a 3x with high quality and velocity.”
Pipeline coverage is an important metric, but it should be evaluated alongside other indicators such as deal age, stalled deal rate, pipeline hygiene, and pipeline slippage to understand the overall health of the pipeline.
How to Increase Pipeline Coverage
If your pipeline coverage ratio is too low, the solution is not always to create more opportunities. The goal is to increase qualified pipeline that has a realistic chance of closing.
The most effective ways to increase pipeline coverage include:
generating more qualified opportunities through outbound prospecting and demand generation
improving lead-to-opportunity conversion rates
increasing average deal size
expanding opportunities within existing accounts
reducing deal churn through better qualification
shortening sales cycles so pipeline is replenished more quickly
improving win rates, which reduces the amount of pipeline required to hit quota
The most successful B2B sales teams focus on both pipeline quantity and pipeline quality. A larger pipeline helps increase coverage, but higher win rates and stronger deal qualification often have an even greater impact on achieving revenue targets.
How to Keep Your Pipeline Coverage Healthy
A healthy pipeline coverage ratio is not a one-time achievement, it requires consistent attention, smart tools, and team alignment. To meet revenue targets and improve forecast coverage, sales leaders must regularly monitor, clean, and optimize their sales pipeline.
Practical tips to maintain a healthy pipeline coverage ratio:
Run weekly pipeline reviews: Stay on top of changes in total pipeline value, deal progression, and coverage by rep or team.
Set minimum pipeline thresholds per sales rep: This ensures individual accountability and prevents pipeline gaps.
Clean the pipeline regularly: Remove stalled, outdated, or unqualified opportunities that inflate your pipeline coverage without contributing to future revenue.
Monitor early-stage conversion rates: Healthy top-of-funnel activity should eventually translate to pipeline value. If not, investigate where deals are falling off.
Use tools like Forecastio: Tools like Forecastio track pipeline coverage, flag missing data, and surface at-risk deals so you can take proactive action.
Segment pipeline coverage: Break down by product line, territory, or customer segment to identify where you're over- or under-covered.
Pipeline Coverage and Sales Forecasting
Pipeline coverage is one of the most important indicators of potential revenue in B2B sales. However, it should not be confused with a sales forecast.
Pipeline coverage simply measures whether the total value of open opportunities is large enough to support your revenue target. A common benchmark is the 3×–4× pipeline coverage ratio, meaning that the value of open deals should be three to four times higher than the quota for a given period.
However, pipeline coverage alone does not answer critical sales forecasting questions such as:
• Which deals are likely to close
• When those deals will close
• Whether the pipeline contains enough qualified opportunities
For example, two companies may both have a 4× pipeline coverage ratio, but their actual outcomes can differ significantly. If one company has stronger deal qualification, higher win rates, and faster deal velocity, its forecast will likely be far more accurate.
To turn pipeline coverage into a reliable input for sales forecasting, companies need to combine it with additional data points, including:
Win rates. Historical win rates help estimate how much of the pipeline is realistically expected to convert into revenue.
Stage conversion data. Analyzing how deals historically move through each pipeline stage provides more realistic probability assumptions.
Deal velocity and timing. Understanding how long deals typically remain in each stage helps determine whether opportunities are likely to close within the forecast period.
Advanced analytics and machine learning. Modern forecasting models can evaluate multiple variables such as deal age, engagement signals, pipeline movement, and historical patterns to assign more accurate probabilities to opportunities.
When these elements are combined, pipeline coverage becomes far more useful. Instead of simply indicating whether the pipeline is “large enough,” it becomes part of a broader forecasting framework that evaluates deal quality, timing, and probability.
Platforms like Forecastio help connect these data points by combining pipeline coverage metrics with historical performance and real-time CRM activity. This allows sales leaders to move beyond static pipeline snapshots and understand:
• Which deals are most likely to close
• Where the pipeline may contain hidden risks
• What actions are needed to reach revenue targets
Advanced Tips and Use Cases
Once you’ve mastered the basics of pipeline coverage, it’s time to use it as a strategic lever. Advanced teams don’t just track pipeline coverage, they analyze it, customize it, and apply it to planning and decision-making across the revenue engine.
Pro-level ways to use pipeline coverage:
Set dynamic pipeline coverage targets
Not every rep needs the same coverage. A top-performing rep with a 40% win rate might only need 2x coverage to hit quota, while a newer rep may need 5x+. Tailoring targets by rep helps set realistic sales targets and boosts team morale.
Adjust by territory or tenure
New reps, new product lines, or underdeveloped territories may need different pipeline coverage ratios. Use historical data to set expectations based on sales cycle length and average deal size.
Visualize month-over-month coverage trends
Don’t rely on one-time snapshots. A declining pipeline coverage ratio over several months may indicate weak pipeline generation or stalled deals, critical insights for sales leaders and revenue operations.
What happens to your forecast if your win rate drops by 5%? Or if your team loses a key rep? By combining pipeline coverage and forecast simulations, you can better prepare for volatility.
Conclusion
Pipeline coverage is one of the simplest and most powerful metrics in B2B sales. When used properly, it gives sales leaders a clear, real-time signal of whether their current pipeline is strong enough to support upcoming revenue targets and sales goals.
But like any metric, pipeline coverage doesn’t work in isolation. To unlock its full value, you must combine it with:
Win rate trends
Stage conversion insights
Deal quality metrics
Forecast accuracy and velocity data
Together, these inputs transform pipeline coverage from a basic ratio into a strategic tool for forecasting, quota planning, and sales performance management.
Pipeline Coverage FAQs
What’s the difference between pipeline coverage and sales velocity?
Pipeline coverage measures the ratio between your total pipeline value and your sales target, giving you insight into whether you have enough open opportunities to hit your number. Sales velocity, on the other hand, tracks how quickly deals move through your sales funnel, factoring in deal size, win rate, and sales cycle length. While pipeline coverage is about how much pipeline you have, sales velocity tells you how fast you're turning pipeline into revenue.
Can I use pipeline coverage for individual reps?
Yes, you can absolutely track pipeline coverage at the individual rep level. In fact, doing so helps sales managers ensure each rep is building and maintaining a healthy pipeline aligned with their personal quota. It also allows for early identification of low pipeline coverage ratios and helps in setting realistic sales targets based on rep performance.
What’s the difference between an unweighted and weighted pipeline?
An unweighted pipeline treats every deal as if it has a 100% chance of closing, showing the total dollar amount in your sales pipeline. A weighted pipeline, on the other hand, assigns probabilities to each deal based on factors like stage, deal age, or historical data, giving a more realistic view of potential revenue. For example, a $100,000 deal at a 30% stage contributes $30,000 to your weighted pipeline value. Weighted pipelines are more useful for accurate forecast coverage, while unweighted ones are better for basic pipeline coverage ratio calculations.
How do you calculate pipeline coverage?
To calculate pipeline coverage, divide your total pipeline value by your sales target for a specific time period (e.g., monthly or quarterly).
Pipeline Coverage = Total Pipeline Value / Sales Target
For example, if your pipeline is worth $600,000 and your target is $200,000, your pipeline coverage ratio is 3x. Be sure to only include deals likely to close within that period and clean out unqualified or outdated opportunities.
What is 4x pipeline coverage?
A 4x pipeline coverage means your current pipeline holds four times the value needed to hit your sales target. For instance, if your quarterly goal is $250,000, a 4x ratio means you have $1 million in open opportunities. Whether this is a healthy pipeline coverage ratio depends on your win rate. If you close 25% of your deals, 4x coverage is typically sufficient. But if your win rate is lower or deals tend to stall, even 4x may not be enough.
Introduction
If you lead a B2B sales team, you’ve likely heard the term pipeline coverage tossed around in meetings, forecast reviews, and boardroom discussions. But how well do you really understand what sales pipeline coverage means — and more importantly, how to measure and use your pipeline coverage ratio efficiently?
Pipeline coverage is a foundational metric in sales management. It tells you whether your current sales pipeline is strong enough to hit your revenue targets.
For clarity, let’s define what is pipeline coverage: it’s the ratio between the total value of deals in your pipeline and your sales target for a specific period. In simple terms, if your team needs $1 million in closed deals and currently has $3 million worth of opportunities in the pipeline, your pipeline coverage ratio is 3x. Understanding this ratio helps sales leaders determine whether they have enough qualified opportunities to meet quota or if they need to increase prospecting efforts.
Knowing how to calculate pipeline coverage accurately requires a structured approach and reliable data. This is where modern pipeline coverage analysis tools like Forecastio make a difference. As a HubSpot-native forecasting solution with 95% accuracy, Forecastio automatically aggregates real-time deal data, identifies gaps, and visualizes coverage trends — allowing leaders to make confident decisions faster. By combining AI forecasts with advanced analytics, businesses can go beyond the basic pipeline coverage ratio definition and gain predictive insights into whether their current pipeline can truly support future growth.
What Is Pipeline Coverage?
Pipeline coverage is a core sales metric that helps sales leaders assess whether their current sales pipeline can support upcoming revenue targets. In simple terms, it shows the ratio between your total pipeline value (i.e., open opportunities) and your sales target for a given period, typically monthly or quarterly.
✅ Sales Pipeline Coverage Formula:
Pipeline Coverage = Total Pipeline Value / Sales Target
This formula helps you measure pipeline coverage efficiently and answer a key question:
“Do we have enough in the pipeline to hit our number?”
Let’s break this down with a basic example:
If your sales team has a current pipeline worth $600,000 and a quarterly sales target of $200,000, your pipeline coverage ratio is:
$600,000 ÷ $200,000 = 3x
That means you have three times the amount of potential revenue needed to hit your goal.
Tracking pipeline coverage in real time with Forecastio
You can also track pipeline coverage at different levels:
Individual rep level: Helps evaluate each rep’s progress toward their quota.
Team or department level: Useful for managing pipeline coverage by region, vertical, or product line.
Company-wide: Helps executives and sales and marketing teams align on how much pipeline generation is needed to hit company-wide revenue goals.
Segmenting your sales pipeline coverage by customer segment, territory, or deal type also allows for better sales forecasting and resource allocation.
💡 Want to avoid spreadsheets and manual math? Forecastio automatically calculates your pipeline coverage ratio across teams, timeframes, and sales reps—helping you build accurate forecasts faster. Book a demo.
Why Pipeline Coverage Matters in B2B Sales
In B2B sales, deals are often long, multi-stakeholder, and unpredictable. That’s why pipeline coverage is more than just a number, it’s a strategic signal. It helps sales leaders quickly assess whether there’s enough pipeline value to support upcoming revenue targets and realistic sales quotas.
A healthy sales pipeline coverage ratio provides early visibility into future performance and allows leaders to take action before it's too late.
Here’s why pipeline coverage is essential:
1. Improves forecast accuracy
Your pipeline coverage and forecast are tightly connected. Without enough pipeline coverage, even the best sales forecasting methods will fail to predict future revenue accurately. If your pipeline coverage ratio is too low, your sales team is at risk of missing quota regardless of how talented they are.
2. Reveals pipeline gaps early
Low pipeline coverage ratio is often the first sign of trouble. By regularly measuring pipeline coverage, leaders can spot gaps in the sales funnel, delayed deals, or missed lead targets and adjust their sales and marketing efforts accordingly.
3. Informs headcount and resource planning
Are there enough opportunities to keep your sales reps productive? Should you invest in more SDRs or marketing campaigns? Understanding how much pipeline coverage you have can help guide critical resourcing decisions, especially in fast-scaling teams.
4. Drives accountability
Tracking pipeline coverage by rep keeps individuals accountable for maintaining a healthy pipeline. It gives sales managers visibility into who is consistently generating enough pipeline value to meet their goals and who might need coaching or support.
📉 Example: Let’s say your team’s average win rate is 25%, and your quarterly revenue target is $400,000.
To hit that number, you’ll need at least $1.6 million in total pipeline value (400,000 ÷ 0.25), meaning your pipeline coverage ratio should be 4x. If your current pipeline is just $800,000 (2x coverage), you’re likely heading for a shortfall unless something changes fast.
How to Calculate Pipeline Coverage
Pipeline coverage is simple to calculate but only if your sales pipeline is clean and your sales targets are clearly defined.
Sales Pipeline Coverage Formula:
Pipeline Coverage = Total Pipeline Value / Sales Target
Steps to Calculate Pipeline Coverage:
Define your time period. Typically monthly or quarterly.
Add up the total value of all open opportunities expected to close in that period.
Divide by your quota or revenue target for the same timeframe.
Example:
Total pipeline value: $1,000,000
Quarterly target: $250,000
Pipeline coverage ratio: 4x
This means you have four times the pipeline value needed to hit your goal—assuming your win rate supports it.
What Is a Good Pipeline Coverage Ratio?
There’s no universal number, but understanding what constitutes a good pipeline coverage ratio is essential for sales forecasting accuracy and smart planning.
Your ideal sales pipeline coverage ratio depends on several factors:
Win rate
Average deal size
Sales cycle length
Historical data and past performance
Still, here are common industry benchmarks to guide your sales strategies:
Sales Type | Typical Pipeline Coverage |
|---|---|
Enterprise Sales | 3x – 5x |
Mid-Market Sales | 2.5x – 4x |
SMB Sales | 2x – 3x |
A healthy pipeline coverage ratio allows your sales team to operate with confidence while still accounting for deal slippage and longer sales cycles.
What Low or High Pipeline Coverage Means
Sales pipeline coverage is a directional metric but it’s not just about hitting a specific number. Whether your pipeline coverage ratio is too low or too high, both situations can signal deeper problems in your sales process, team performance, or forecasting strategy.
Low Pipeline Coverage
If your pipeline coverage is consistently under 2x, it’s a red flag, especially in B2B sales where longer sales cycles and complex deals are the norm.
What low pipeline coverage might mean:
Inadequate pipeline generation from both marketing teams and outbound sales efforts
High deal churn or weak lead qualification processes
Unrealistic quotas that don’t reflect the market or past performance
How to fix it:
Ramp up outbound and demand generation to grow your total value of opportunities
Qualify leads more rigorously to reduce no-decision or lost deals
Measure pipeline coverage by sales rep to identify individual or segment-level gaps
High Pipeline Coverage
On the other hand, an excessively high pipeline coverage ratio isn’t necessarily good news. It can give sales leaders a false sense of security.
What high pipeline coverage might indicate:
A bloated sales pipeline filled with low-probability or stalled deals
Reps padding the pipeline with unqualified opportunities to appear active
Lack of consistent deal qualification and pipeline hygiene
Best Practices:
Prioritize deal quality over volume
Monitor stage-by-stage conversion rates to spot friction in the sales funnel
Use deal aging reports and scoring models to eliminate stale or dead deals
Challenges of Using Pipeline Coverage as a Metric
While pipeline coverage is a valuable and widely used metric in B2B sales, it’s not without its limitations. It provides a quick directional snapshot of whether your sales pipeline can support your sales targets but it doesn't tell the whole story.
✅ Pros of Using Pipeline Coverage:
Simple and fast to calculate with a clear sales pipeline coverage formula
Offers directional insight into quota coverage
Useful for early-stage sales planning and pipeline generation tracking
⚠️ Cons and Limitations:
Doesn’t reflect deal quality or potential revenue
Easy to manipulate by logging unqualified leads as deals
A static snapshot that doesn’t factor in deal velocity, aging, or sales cycle length
Misleading when used in isolation without context like win rate or forecast accuracy
To manage pipeline coverage effectively and avoid misinterpretation, you should always pair it with complementary metrics:
📊 Always Combine Pipeline Coverage With:
Win rate trends: Are you actually closing the amount your coverage suggests?
Deal velocity: How fast are deals moving through your sales funnel?
Forecast accuracy: Does your pipeline coverage align with real outcomes?
Stage progression: Are deals advancing—or just sitting idle?
“A 5x coverage with low win rates and zero movement isn’t better than a 3x with high quality and velocity.”
Pipeline coverage is an important metric, but it should be evaluated alongside other indicators such as deal age, stalled deal rate, pipeline hygiene, and pipeline slippage to understand the overall health of the pipeline.
How to Increase Pipeline Coverage
If your pipeline coverage ratio is too low, the solution is not always to create more opportunities. The goal is to increase qualified pipeline that has a realistic chance of closing.
The most effective ways to increase pipeline coverage include:
generating more qualified opportunities through outbound prospecting and demand generation
improving lead-to-opportunity conversion rates
increasing average deal size
expanding opportunities within existing accounts
reducing deal churn through better qualification
shortening sales cycles so pipeline is replenished more quickly
improving win rates, which reduces the amount of pipeline required to hit quota
The most successful B2B sales teams focus on both pipeline quantity and pipeline quality. A larger pipeline helps increase coverage, but higher win rates and stronger deal qualification often have an even greater impact on achieving revenue targets.
How to Keep Your Pipeline Coverage Healthy
A healthy pipeline coverage ratio is not a one-time achievement, it requires consistent attention, smart tools, and team alignment. To meet revenue targets and improve forecast coverage, sales leaders must regularly monitor, clean, and optimize their sales pipeline.
Practical tips to maintain a healthy pipeline coverage ratio:
Run weekly pipeline reviews: Stay on top of changes in total pipeline value, deal progression, and coverage by rep or team.
Set minimum pipeline thresholds per sales rep: This ensures individual accountability and prevents pipeline gaps.
Clean the pipeline regularly: Remove stalled, outdated, or unqualified opportunities that inflate your pipeline coverage without contributing to future revenue.
Monitor early-stage conversion rates: Healthy top-of-funnel activity should eventually translate to pipeline value. If not, investigate where deals are falling off.
Use tools like Forecastio: Tools like Forecastio track pipeline coverage, flag missing data, and surface at-risk deals so you can take proactive action.
Segment pipeline coverage: Break down by product line, territory, or customer segment to identify where you're over- or under-covered.
Pipeline Coverage and Sales Forecasting
Pipeline coverage is one of the most important indicators of potential revenue in B2B sales. However, it should not be confused with a sales forecast.
Pipeline coverage simply measures whether the total value of open opportunities is large enough to support your revenue target. A common benchmark is the 3×–4× pipeline coverage ratio, meaning that the value of open deals should be three to four times higher than the quota for a given period.
However, pipeline coverage alone does not answer critical sales forecasting questions such as:
• Which deals are likely to close
• When those deals will close
• Whether the pipeline contains enough qualified opportunities
For example, two companies may both have a 4× pipeline coverage ratio, but their actual outcomes can differ significantly. If one company has stronger deal qualification, higher win rates, and faster deal velocity, its forecast will likely be far more accurate.
To turn pipeline coverage into a reliable input for sales forecasting, companies need to combine it with additional data points, including:
Win rates. Historical win rates help estimate how much of the pipeline is realistically expected to convert into revenue.
Stage conversion data. Analyzing how deals historically move through each pipeline stage provides more realistic probability assumptions.
Deal velocity and timing. Understanding how long deals typically remain in each stage helps determine whether opportunities are likely to close within the forecast period.
Advanced analytics and machine learning. Modern forecasting models can evaluate multiple variables such as deal age, engagement signals, pipeline movement, and historical patterns to assign more accurate probabilities to opportunities.
When these elements are combined, pipeline coverage becomes far more useful. Instead of simply indicating whether the pipeline is “large enough,” it becomes part of a broader forecasting framework that evaluates deal quality, timing, and probability.
Platforms like Forecastio help connect these data points by combining pipeline coverage metrics with historical performance and real-time CRM activity. This allows sales leaders to move beyond static pipeline snapshots and understand:
• Which deals are most likely to close
• Where the pipeline may contain hidden risks
• What actions are needed to reach revenue targets
Advanced Tips and Use Cases
Once you’ve mastered the basics of pipeline coverage, it’s time to use it as a strategic lever. Advanced teams don’t just track pipeline coverage, they analyze it, customize it, and apply it to planning and decision-making across the revenue engine.
Pro-level ways to use pipeline coverage:
Set dynamic pipeline coverage targets
Not every rep needs the same coverage. A top-performing rep with a 40% win rate might only need 2x coverage to hit quota, while a newer rep may need 5x+. Tailoring targets by rep helps set realistic sales targets and boosts team morale.
Adjust by territory or tenure
New reps, new product lines, or underdeveloped territories may need different pipeline coverage ratios. Use historical data to set expectations based on sales cycle length and average deal size.
Visualize month-over-month coverage trends
Don’t rely on one-time snapshots. A declining pipeline coverage ratio over several months may indicate weak pipeline generation or stalled deals, critical insights for sales leaders and revenue operations.
What happens to your forecast if your win rate drops by 5%? Or if your team loses a key rep? By combining pipeline coverage and forecast simulations, you can better prepare for volatility.
Conclusion
Pipeline coverage is one of the simplest and most powerful metrics in B2B sales. When used properly, it gives sales leaders a clear, real-time signal of whether their current pipeline is strong enough to support upcoming revenue targets and sales goals.
But like any metric, pipeline coverage doesn’t work in isolation. To unlock its full value, you must combine it with:
Win rate trends
Stage conversion insights
Deal quality metrics
Forecast accuracy and velocity data
Together, these inputs transform pipeline coverage from a basic ratio into a strategic tool for forecasting, quota planning, and sales performance management.
Pipeline Coverage FAQs
What’s the difference between pipeline coverage and sales velocity?
Pipeline coverage measures the ratio between your total pipeline value and your sales target, giving you insight into whether you have enough open opportunities to hit your number. Sales velocity, on the other hand, tracks how quickly deals move through your sales funnel, factoring in deal size, win rate, and sales cycle length. While pipeline coverage is about how much pipeline you have, sales velocity tells you how fast you're turning pipeline into revenue.
Can I use pipeline coverage for individual reps?
Yes, you can absolutely track pipeline coverage at the individual rep level. In fact, doing so helps sales managers ensure each rep is building and maintaining a healthy pipeline aligned with their personal quota. It also allows for early identification of low pipeline coverage ratios and helps in setting realistic sales targets based on rep performance.
What’s the difference between an unweighted and weighted pipeline?
An unweighted pipeline treats every deal as if it has a 100% chance of closing, showing the total dollar amount in your sales pipeline. A weighted pipeline, on the other hand, assigns probabilities to each deal based on factors like stage, deal age, or historical data, giving a more realistic view of potential revenue. For example, a $100,000 deal at a 30% stage contributes $30,000 to your weighted pipeline value. Weighted pipelines are more useful for accurate forecast coverage, while unweighted ones are better for basic pipeline coverage ratio calculations.
How do you calculate pipeline coverage?
To calculate pipeline coverage, divide your total pipeline value by your sales target for a specific time period (e.g., monthly or quarterly).
Pipeline Coverage = Total Pipeline Value / Sales Target
For example, if your pipeline is worth $600,000 and your target is $200,000, your pipeline coverage ratio is 3x. Be sure to only include deals likely to close within that period and clean out unqualified or outdated opportunities.
What is 4x pipeline coverage?
A 4x pipeline coverage means your current pipeline holds four times the value needed to hit your sales target. For instance, if your quarterly goal is $250,000, a 4x ratio means you have $1 million in open opportunities. Whether this is a healthy pipeline coverage ratio depends on your win rate. If you close 25% of your deals, 4x coverage is typically sufficient. But if your win rate is lower or deals tend to stall, even 4x may not be enough.
Share:
Alex is the CEO at Forecastio, bringing over 15 years of experience as a seasoned B2B sales expert and leader in the tech industry. His expertise lies in streamlining sales operations, developing robust go-to-market strategies, enhancing sales planning and forecasting, and refining sales processes.
Alex is the CEO at Forecastio, bringing over 15 years of experience as a seasoned B2B sales expert and leader in the tech industry. His expertise lies in streamlining sales operations, developing robust go-to-market strategies, enhancing sales planning and forecasting, and refining sales processes.
Related articles

May 29, 2026
12 min

May 29, 2026
8 min

Sales Strategies
May 29, 2026
17 min
May 29, 2026
12 min
May 29, 2026
8 min
May 29, 2026
12 min
May 29, 2026
8 min
Sales Planning
Sales Forecasting
Sales Performance Insights
Sales Planning
Sales Forecasting
Sales Performance Insights
Sales Planning
Sales Forecasting
Sales Performance Insights


Product
© 2025 Forecastio, All rights reserved.
Sales Planning
Sales Forecasting
Sales Performance Insights
Sales Planning
Sales Forecasting
Sales Performance Insights
Sales Planning
Sales Forecasting
Sales Performance Insights
Product
© 2025 Forecastio, All rights reserved.
Sales Planning
Sales Forecasting
Sales Performance Insights
Sales Planning
Sales Forecasting
Sales Performance Insights
Sales Planning
Sales Forecasting
Sales Performance Insights
Product
© 2025 Forecastio, All rights reserved.