
Sales Data Analysis for B2B Sales Teams: Methods, Tools, and ML Applications

Alex Zlotko
CEO at Forecastio

Introduction
Sales data analysis is no longer a luxury, it’s a critical pillar of success for modern B2B sales teams. In an environment defined by longer deal cycles, multi-stakeholder buying committees, and increasingly complex sales processes, relying on instinct alone is a fast track to missed sales targets, poor pipeline visibility, and stalled growth. The only way to consistently hit quota and drive revenue is by analyzing sales data to gain valuable insights and make informed, data-driven decisions.
Predictive analytics in sales forecasting takes this a step further by using historical data, behavioral trends, and machine learning to anticipate future outcomes and help sales teams act before problems arise.
When executed properly, sales analysis enables teams to improve forecast accuracy, optimize sales performance, and identify issues before they become revenue killers. It empowers sales managers to evaluate both high-level trends and granular sales performance analysis metrics - boosting everything from sales rep productivity to sales pipeline analysis.
“Without data, you’re just another person with an opinion.” — W. Edwards Deming
In this comprehensive guide, we’ll walk you through every aspect of sales analytics for B2B organizations. You’ll learn how to:
Approach the sales analysis process with a structured methodology
Use machine learning for predictive sales analysis
Prepare your sales data for in-depth analysis
Leverage the best sales analytics software, including platforms like Forecastio, to gain valuable insights from your historical sales data
Whether you're a sales leader, RevOps manager, or simply want to improve how your team uses data, this guide will help you transform your sales analysis reports into smarter strategies, sharper execution, and stronger results.
Types of Sales Data in B2B Companies
Effective sales data analysis starts with understanding what types of data your company collects and how each category impacts decision-making. B2B sales teams deal with massive volumes of structured and unstructured data every day — from CRM entries and lead sources to customer behavior and sales activity logs. Organizing this data correctly enables accurate forecasting, smarter goal setting, and strategic planning. The foundation of strong B2B sales data analysis lies in identifying which metrics truly drive growth and using them to shape consistent, repeatable processes.
In modern revenue teams, B2B sales analytics isn’t just about tracking performance — it’s about connecting insights to action. Platforms like Forecastio simplify this by combining real-time sales data analytics with predictive intelligence. With 95% forecast accuracy, automated pipeline insights, and full HubSpot integration, Forecastio transforms your raw data into meaningful forecasts that support confident decision-making.
If you’re building a structured approach to analytics, start by mapping the essential data categories covered in this sales analytics guide — including activity data, pipeline metrics, conversion rates, and customer lifecycle insights. Once analyzed and visualized properly, these data types become powerful tools for predicting future revenue and optimizing your overall sales performance.
Here are the key categories of sales data B2B companies should track and analyze:
1. Lead and Contact Data
Includes information like lead source, industry, job title, location, and level of engagement. This data helps sales and marketing teams optimize customer acquisition costs and tailor outreach strategies based on customer preferences and behavior patterns.
2. Opportunity and Deal Data
Tracks details such as pipeline stage, deal size, expected close date, and forecast category. This forms the backbone of any sales forecasting effort and is vital for pipeline analysis and sales trend analysis.
3. Sales Activity Data
Covers emails, calls, demos, meetings, and follow-ups logged by sales reps. These touchpoints reveal the level of effort behind each opportunity and support sales performance tracking.
4. Pipeline Metrics
Includes pipeline coverage ratio, stage conversion rates, pipeline aging, and velocity. These key performance indicators (KPIs) are crucial for analyzing sales data at both team and individual levels.
5. Revenue Metrics
Looks at bookings, quota attainment, average revenue generated, and recurring revenue (MRR/ARR). These indicators help forecast future sales and evaluate overall business health.
6. Customer Data
Gathers data on company size, industry, lifecycle stage, customer lifetime value, satisfaction scores, and renewal likelihood. It supports customer relationship management and helps identify upsell or churn risks.
7. Rep Performance Metrics
Focuses on individual rep metrics like win rate, deal velocity, activity consistency, and close rate. These insights are key to sales team performance management and coaching.
💡 Did you know? High-performing sales organizations are 1.5x more likely to use data-driven forecasting than underperforming teams.
— Salesforce State of Sales Report
Common Use Cases of Sales Data Analysis
Sales data analysis is only valuable when it drives action and outcomes. For modern B2B organizations, analyzing sales data helps transform raw numbers into valuable insights that directly improve sales performance, efficiency, and strategy.
Below are the most common and impactful use cases where B2B sales teams apply sales analytics to boost results:
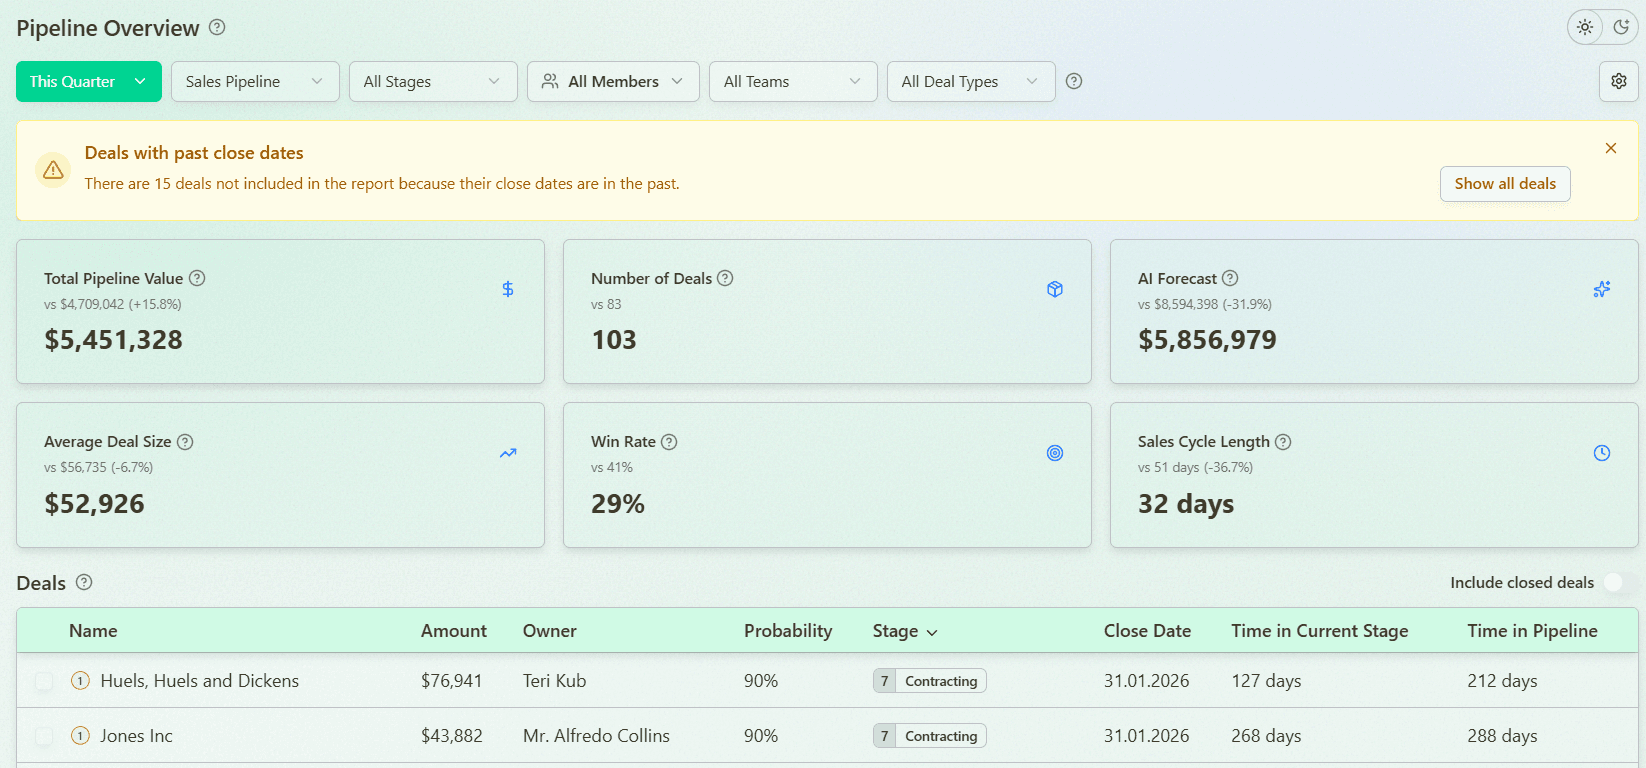
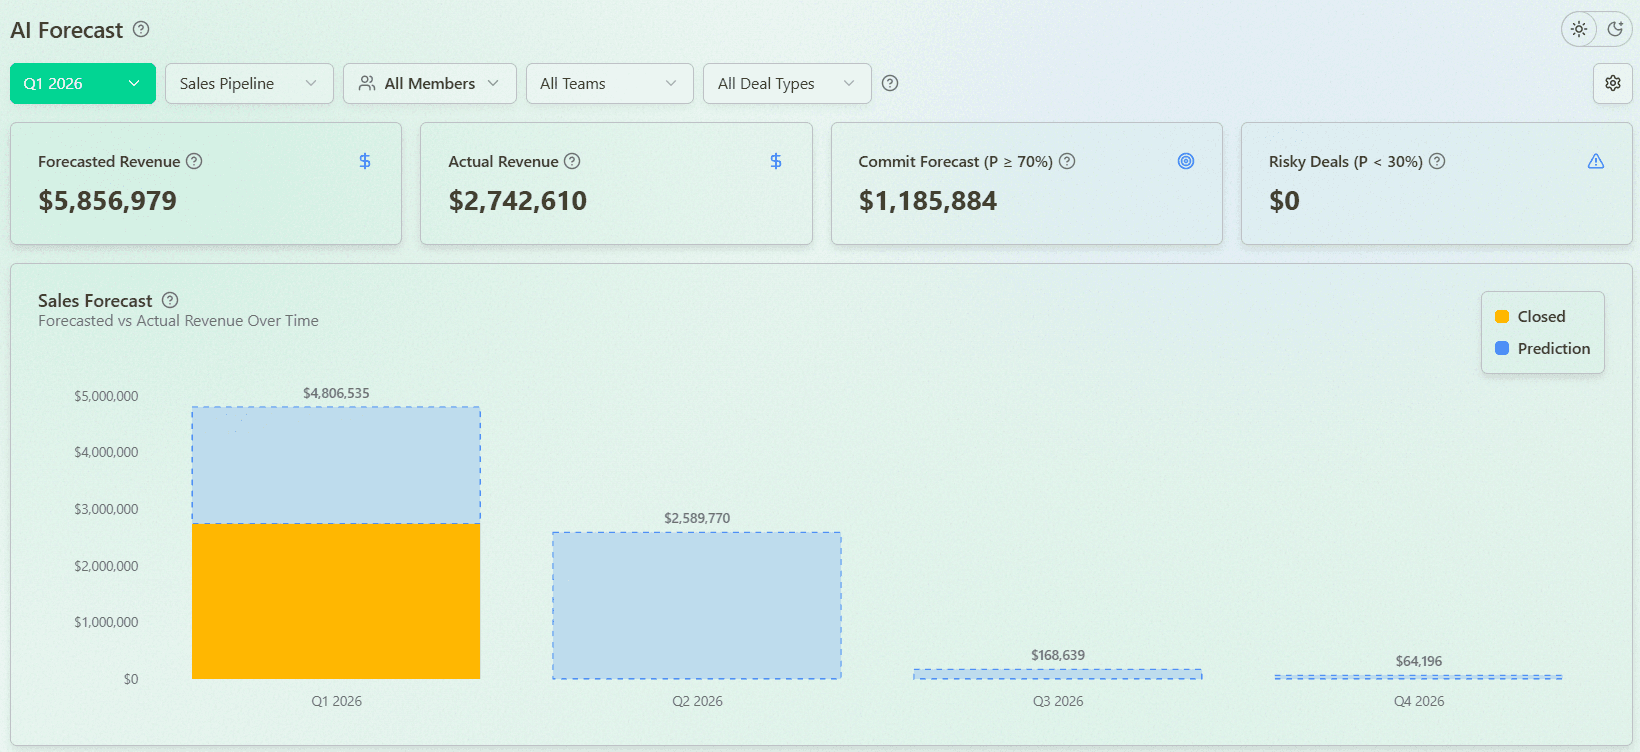
1. Forecast Revenue and Pipeline Health
By applying predictive sales analysis to both historical sales data and current pipeline metrics, companies can forecast future sales with greater accuracy. This enables more reliable resource planning and helps leaders avoid end-of-quarter surprises. Tools like Forecastio automate pipeline analysis and provide real-time visibility into risk and trends.
Forecast accuracy is only as strong as the quality of the pipeline behind it.
One of the areas where predictive sales analysis can be especially valuable is revenue leakage. By tracking trends in metrics like slippage rate and predicting which deals are likely to move to future periods, teams can identify risks early and understand how they will impact forecast accuracy and sales targets. From our observations, most B2B companies operate with a 20–25% slippage rate, which is generally acceptable, but in some cases it can reach 40%, making accurate forecasting nearly impossible.
2. Identify Top-Performing Reps, Segments, or Channels
Sales performance analysis allows leaders to benchmark sales reps, analyze channel effectiveness, and isolate high-performing customer segments. This ensures your sales and marketing efforts are focused where they deliver the most return.
Sales Rep Performance Tracking with Forecastio
3. Detect At-Risk Deals
Through sales trend analysis and deal scoring, teams can identify stalled opportunities, gaps in activity, and risks based on sales rep behavior or customer signals. Acting early improves win rates and shortens the sales cycle.
4. Optimize Sales Processes and Playbooks
Analyzing sales data helps uncover inefficiencies in the sales funnel, such as low stage conversion rates or long deal cycles. These insights support better coaching, updated sales strategies, and stronger execution across the board.
5. Track Funnel Conversion Rates
Monitoring conversion rates between stages helps diagnose bottlenecks and optimize performance at each level of the sales pipeline. This is crucial for maintaining sales momentum and achieving quota.
6. Align Sales and Marketing
Tying closed-won and lost data to lead sources and campaign efforts helps both sales and marketing teams optimize messaging, prioritize high-converting channels, and collaborate more effectively.
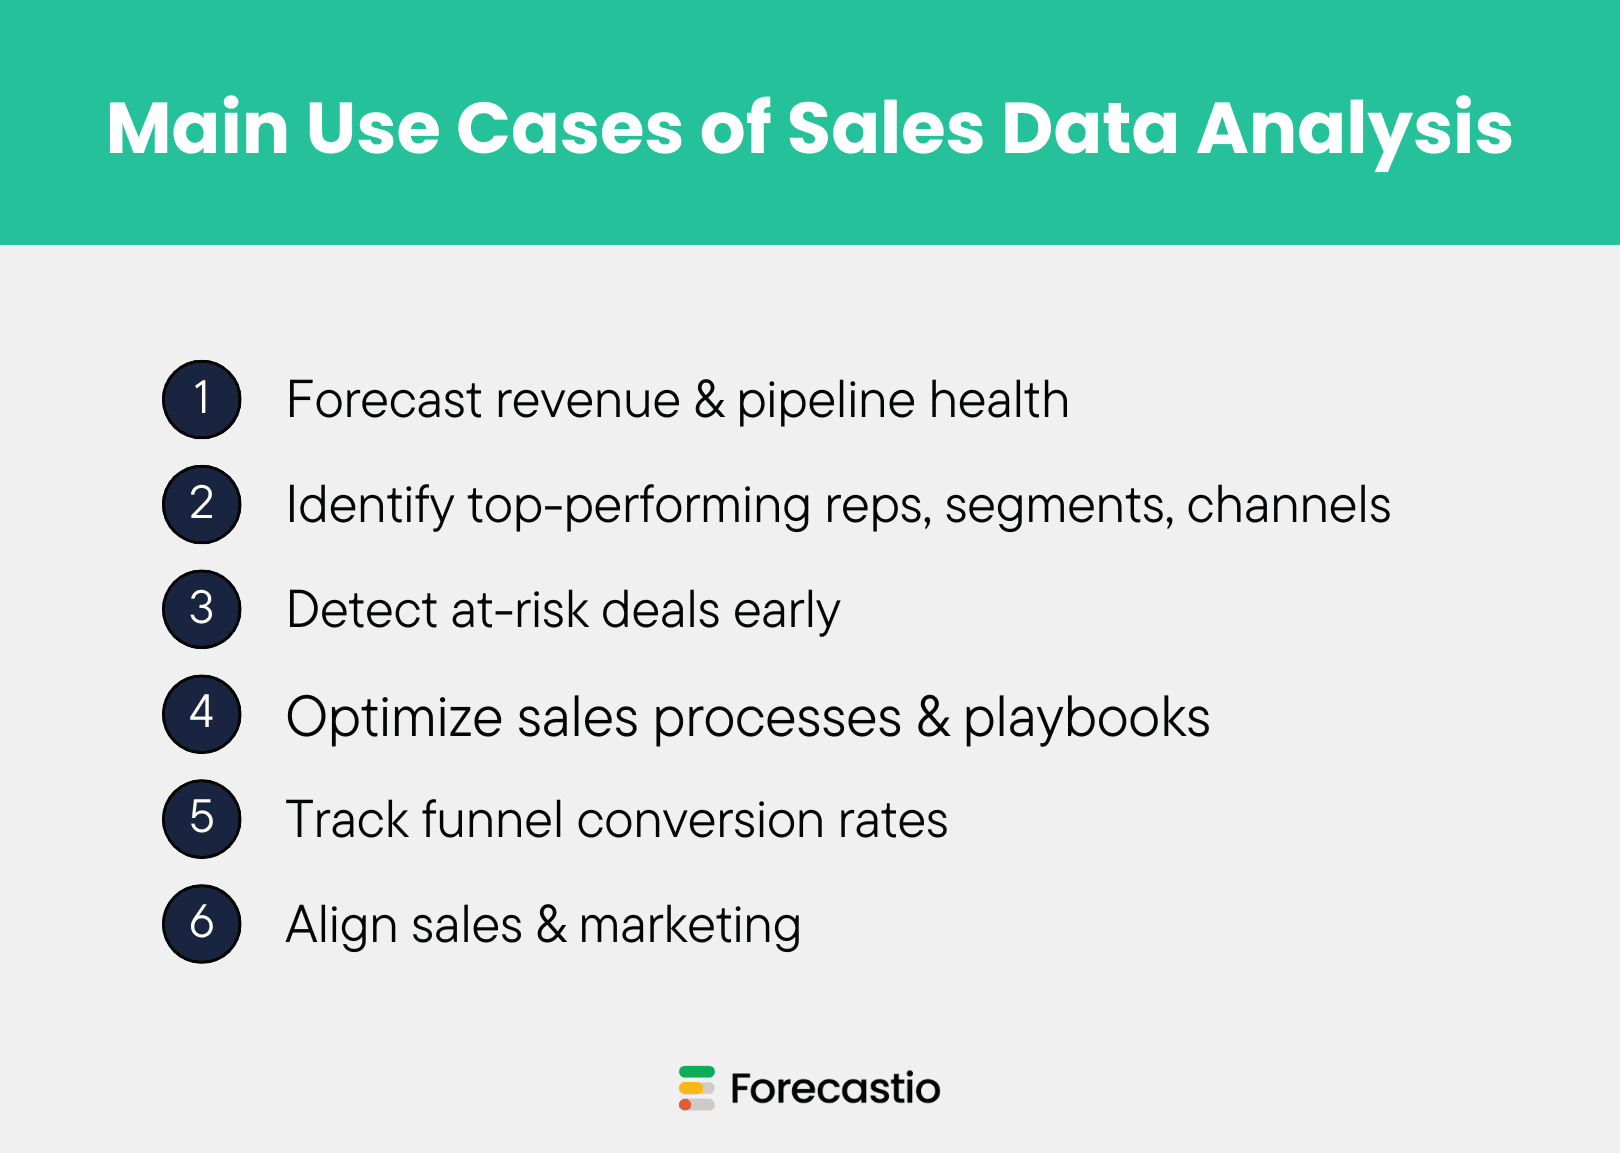
Use Cases of Sales Data Analysis
📊 Stat: According to McKinsey, B2B companies that leverage advanced sales analytics software can improve sales productivity by up to 20% and increase revenue by 10% or more.
How to Analyze Sales Data: A Quick Overview
Sales data analysis is the process of collecting, organizing, and evaluating sales information to identify trends, improve sales performance, and make better business decisions.
At a high level, the process includes:
Defining clear objectives and KPIs.
Collecting data from CRM, marketing, and sales platforms.
Cleaning and standardizing the data.
Analyzing key sales metrics and trends.
Identifying bottlenecks, risks, and growth opportunities.
Turning insights into actions and tracking results.
While this overview explains the basic approach, the sections below provide a more detailed sales data analysis process, including data preparation, accuracy management, machine learning applications, and best practices.
How to Prepare Sales Data for Analysis
Before diving into dashboards, KPIs, or machine learning models, you need a solid foundation. Accurate, consistent, and well-organized sales data is the prerequisite for meaningful sales data analysis. In fact, poor data quality is one of the biggest reasons sales analytics initiatives fail to deliver real value.
Here’s how B2B sales teams can properly prepare their data for in-depth sales analysis and better decision-making:
1. Unify Your Data Sources
Start by integrating your CRM with sales engagement platforms, email tools, call tracking systems, and marketing platforms. A unified view of all customer interactions—from first touch to closed-won—gives you a more complete dataset for sales performance analysis and pipeline forecasting. Forecastio connects seamlessly to HubSpot, helping teams unify and sync their current sales data for faster insights.
2. Clean Your Data
Run regular audits to remove duplicates, correct typos, and fill in missing values. Incomplete or inaccurate records can skew your sales analysis metrics and lead to misinformed decisions. Clean data = clean insights.
3. Normalize Data Inputs
Use consistent naming conventions for deal stages, lead sources, rep names, and sales territories. Standardized data makes it easier to analyze sales, compare performance across segments, and spot meaningful patterns over time.
4. Tag and Categorize
Add tags for industry, product line, region, deal type, or any other relevant attribute. Categorization enables advanced filtering in your sales analysis reports and allows you to drill down by market segment or customer behavior.
5. Track Historical Changes
Set up audit trails and change logs to track updates in deal stages, ownership, or expected close dates. Historical visibility is essential for sales trend analysis, accurate forecasting, and understanding what changed and why.
📉 Stat: Up to 30% of CRM data is either inaccurate, incomplete, or outdated, according to IBM. Cleaning and structuring your data can significantly boost the ROI of your sales analytics efforts.
How to Achieve Sales Data Accuracy
No matter how advanced your sales analytics software is, it’s only as good as the data it processes. Inaccurate or incomplete sales data leads to flawed forecasts, misleading reports, and poor sales performance analysis. That’s why ensuring sales data accuracy isn’t just an ops responsibility—it’s a strategic priority for every B2B sales team.
Here are five proven steps to improve data accuracy and strengthen the foundation of your sales data analysis process:
1. Make Key Fields Mandatory
Set required fields in your CRM for critical inputs like deal stage, expected close date, deal amount, lead source, and rep ownership. This ensures the minimum data needed for sales forecasting, pipeline analysis, and sales trend analysis is always captured.
2. Automate Data Collection
Use integrations to auto-log emails, calls, meetings, and notes. Automation reduces manual entry errors and ensures customer interactions are consistently tracked—critical for reliable sales activity analysis.
3. Audit Data Regularly
Schedule weekly or monthly data audits to catch inconsistencies, duplicates, or missing entries. Even spot-checking 5–10% of records can reveal systemic issues that affect the quality of your sales analysis reports.
4. Define Data Ownership
Assign clear responsibility for maintaining clean data. Whether it’s a RevOps manager, team lead, or rep, someone should own data hygiene for each segment of your pipeline or account base.
5. Train Reps on Data Importance
Educate sales reps on why clean data matters not just for their own quota tracking but for team-wide sales performance management, compensation, and territory planning. When reps understand the value, compliance improves.
📊 Stat: According to Experian, 91% of companies suffer from common data errors, including outdated information, typos, and missing fields—directly impacting reporting and sales analytics accuracy.
Sales Data Analysis Process
To drive meaningful change through sales data analysis, B2B sales teams need more than just dashboards—they need a repeatable, structured approach. The following five-step sales analysis process helps you move from raw sales data to informed decisions that improve sales performance, optimize the sales funnel, and boost revenue.
1. Set Clear Objectives
Start with clarity. Are you trying to improve sales team performance? Reduce pipeline churn? Understand why deals are stalling? Defining your goals ensures that your sales analysis focuses on the right key metrics and supports actionable outcomes.
2. Gather Data from Key Sources
Pull data from your CRM, marketing automation tools, email platforms, call logs, and customer success platforms. This includes both historical sales data and current sales data across multiple touchpoints. Tools like Forecastio centralize this process by automatically syncing and consolidating your most important data from HubSpot.
3. Clean and Preprocess Your Data
Before diving into charts and reports, clean the data: remove duplicates, fill in missing fields, and normalize naming conventions. Add relevant context such as tagging industries, products, or geographies. Accurate, structured data is the backbone of high-quality sales analytics and predictive sales analysis.

Sales Analysis Process
4. Run the Analysis
Use modern sales analytics software to run performance breakdowns, trend tracking, and pipeline analysis. Analyze patterns in customer behavior, conversion rates, and sales team activity. Identify where you're losing deals, which reps outperform, and which channels bring in the most revenue.
5. Take Action and Track Outcomes
The goal of analyzing sales data isn’t just insight, it’s impact. Use findings to adjust sales strategies, improve sales processes, and coach reps. Then measure how those changes affect your sales performance and refine continuously.
💡 Stat: Companies that use structured sales data analysis to guide decision-making see a 15–20% increase in sales productivity. — McKinsey & Company
Tools for Sales Data Analysis
Choosing the right tools is essential for effective sales data analysis. The right platform can help you analyze sales, uncover trends, monitor sales performance, and make data-driven decisions with confidence. Depending on your sales team’s size, technical maturity, and goals, you’ll likely combine multiple tools for complete visibility.
Here’s a breakdown of the most common categories of sales analytics software used by B2B companies:
1. CRMs (Customer Relationship Management)
HubSpot and Salesforce are widely used to collect sales data and provide basic reporting capabilities. While great for storing customer interactions, lead details, and historical sales data, they often fall short in advanced sales performance analysis and predictive sales analysis unless paired with additional tools.
2. BI Tools (Business Intelligence)
Tableau, Looker, and Power BI offer customizable dashboards and robust data analysis capabilities. These are ideal for companies with strong data teams that want full control over sales performance metrics, segmentation, and visualization. However, they require setup, ongoing maintenance, and a learning curve—making them less accessible for frontline sales managers.
3. Revenue Intelligence Platforms
Platforms like Clari, Gong, and Forecastio are built specifically for sales teams. They offer out-of-the-box sales analytics, pipeline analysis, forecasting, and sales performance tracking with less reliance on IT support. Forecastio, in particular, integrates deeply with HubSpot, enabling mid-market B2B teams to track pipeline health, improve forecast accuracy, and detect performance risks without complex setups.

4. Spreadsheets
Google Sheets and Excel remain popular for ad-hoc analysis and quick custom reporting. While flexible, they can be error-prone, siloed, and time-consuming—especially as your sales data scales.
📊 Stat: According to Gartner, 87% of sales leaders say they plan to increase investment in sales analytics tools over the next two years to improve forecasting and performance visibility.
Using Machine Learning for Sales Data Analysis
As B2B sales becomes more complex and data-rich, machine learning (ML) is emerging as a game-changer in sales data analysis. Traditional methods answer what happened, but ML helps predict what’s likely to happen—bringing automation, scale, and intelligence to your sales analysis process.
Let’s break it down:
a. What Machine Learning Adds
Predictive sales analysis powered by ML goes beyond dashboards and static reports. It identifies hidden patterns, detects deal risks early, and analyzes thousands of variables simultaneously—delivering insights no human could surface manually.
ML allows sales teams to:
Transition from descriptive to predictive analytics
Automate sales forecasting and sales performance analysis
Scale insights across deals, reps, and timeframes
Make faster, data-driven decisions
Platforms like Forecastio are building ML-powered forecasting and deal intelligence on top of HubSpot data to help teams achieve this shift with ease.

However, machine learning is not a silver bullet. The quality of predictions still depends heavily on data consistency and process discipline. Even the best models will struggle if deal stages, close dates, or activities are not updated regularly.
b. ML Use Cases in Sales Data Analysis
Machine learning enhances many high-impact sales analytics areas:
Lead scoring: Identify leads most likely to convert based on past behaviors and firmographics
Win prediction: Flag at-risk deals using activity data, deal stage, and historical signals
Sales forecasting: Predict revenue by combining historical sales data with real-time inputs
Churn analysis: Spot customers likely to cancel or go dark based on engagement patterns
Sales rep coaching: Detect which actions or behaviors lead to quota attainment
Next-best action: Recommend what reps should do next—send an email, schedule a call, or escalate
🧠 Stat: Organizations using AI/ML in sales processes see up to 50% higher lead conversion rates and 40–60% cost reductions, according to Harvard Business Review.
c. Data Requirements for ML in Sales
Machine learning only performs well when fueled by quality data. Here’s what’s needed:
Large volume of historical sales data across deals, activities, and outcomes
Structured, labeled fields: pipeline stages, timestamps, lead sources, close reasons
Consistent tracking of sales rep activity, pipeline changes, and customer behavior patterns
d. Common Challenges
Despite its power, ML in sales comes with hurdles:
Garbage in, garbage out: Inaccurate data leads to flawed predictions
Black-box risk: Some models offer little visibility into why they make certain decisions
Team skepticism: Reps and managers must trust the system or they won’t use the insights
🚀 Want to bring predictive intelligence to your sales team?
👉 Book a demo of Forecastio and see how machine learning can transform your sales data analysis and forecasting accuracy.
How to Get Started with Machine Learning in Sales
While machine learning can unlock game-changing insights through sales data analysis, getting started doesn’t mean building complex algorithms overnight. For B2B sales teams, the best approach is gradual, practical, and aligned with clear business goals.
Here’s a simple roadmap to launch your first ML-powered sales analytics initiative:
1. Start with Data Readiness
Before you can apply predictive sales analysis, you need high-quality, structured sales data. Audit your CRM to identify missing fields, inconsistent stage names, and outdated records. Focus on cleaning up historical sales data, ensuring your pipeline movements, timestamps, and activity logs are complete. Forecastio helps teams run automated CRM audits and flag data gaps that could impact model performance.
2. Pick a Clear Use Case
Don’t try to solve everything at once. Start with a specific, high-impact use case like:
Win prediction for open deals
Lead scoring for inbound funnels
Choosing one clear objective makes it easier to measure success and gather feedback.
3. Choose Your ML Approach
You have two paths:
Custom-built models using internal data science resources (more control, more effort)
Sales analytics software like Forecastio that offers pre-built, ML-powered forecasting and deal scoring on top of your existing HubSpot data
4. Test and Validate
Monitor performance closely. Are predictions accurate? Are reps using the insights? Is sales performance improving? Gather feedback from frontline users and validate with actual outcomes over time. Look at trends in forecast accuracy, rep behavior, and closed-won conversions.
5. Scale Gradually
Once you trust the output and see ROI, begin applying ML to more use cases. But avoid the temptation to automate everything immediately. Scaling sales data analysis with ML requires change management, trust, and continuous improvement.
🤖 Stat: Gartner predicts that by 2026, 65% of B2B sales organizations will transition from intuition-based to data-driven decision-making, heavily supported by machine learning and sales analytics software.
Best Practices for Sales Data Analysis
Successful sales data analysis isn’t just about collecting data, it’s about using it effectively. For B2B sales teams, following proven best practices helps turn raw data into valuable insights that directly improve sales performance, forecast accuracy, and strategic alignment.
Here are five best practices to guide your sales analysis process:
1. Define Clear KPIs Aligned with Business Goals
Start by identifying the key performance indicators (KPIs) that matter most to your organization. Whether it’s quota attainment, average deal size, or sales funnel conversion rates, your analysis should always align with core objectives like revenue growth, customer retention, or market expansion.
2. Use Both Leading and Lagging Indicators
Track a mix of:
Leading indicators: Activities, meetings booked, new pipeline created
Lagging indicators: Closed revenue, win rate, churn rate
This dual approach helps you forecast future sales while also understanding historical results.
3. Visualize Trends—Not Just Totals
Totals don’t tell the full story. Use sales trend analysis to spot shifts in customer behavior, rep performance, or campaign impact over time. Visualizations in tools like Forecastio make it easier to track changes in sales metrics and take proactive action.
4. Keep It Actionable—Avoid Vanity Metrics
Not all metrics matter. Focus on numbers that guide decisions and improve outcomes. Avoid vanity stats like total emails sent or demo invites unless they tie directly to sales and marketing efforts that drive results.
5. Review Insights Regularly
Make sales analytics a recurring part of your workflow not a quarterly activity. Review reports and dashboards in weekly team meetings, pipeline reviews, and performance reviews. Use insights to coach reps, adjust tactics, and refine strategy.
📈 Stat: Teams that regularly review and act on sales analysis metrics outperform their peers by up to 25% in quota attainment, according to Forrester.
Common Mistakes to Avoid in Sales Data Analysis
Even with the right tools and intentions, many B2B sales teams fall into traps that undermine the value of their sales data analysis. Avoiding these pitfalls ensures that your efforts translate into better sales performance, stronger forecast accuracy, and actionable outcomes.
Here are the top mistakes to watch out for—each with a quick icon for clarity:
🔍 Focusing Only on Closed-Won Deals
Too many teams analyze just their wins. Ignoring lost or stalled deals means missing opportunities to improve sales strategies, fix sales funnel bottlenecks, and reduce churn. Valuable lessons often lie in failure.
📊 Overengineering Reports No One Uses
Complex dashboards may look impressive, but if they don’t lead to decisions, they’re just noise. Keep your sales analysis reports clean, relevant, and aligned with your team’s goals and usage habits. Platforms like Forecast are designed to prioritize actionable insights, not vanity metrics.
🖊️ Relying on Manual Data Entry Without Automation
Manual inputs are error-prone and easily skipped. Automate the logging of customer interactions, meetings, and activities wherever possible to ensure your sales data is consistent and complete.
📚 Skipping Training for Reps and Managers
Even the best sales analytics software is wasted if your team doesn’t know how to use the data. Regularly train both sales reps and managers on how to read insights, interpret sales performance analysis, and act on recommendations.
🔄 Not Revisiting Metrics as Strategy Evolves
Your business changes—your sales KPIs should too. What mattered last quarter may not reflect this quarter’s goals. Regularly review and update the sales analysis metrics you track to stay aligned with your evolving strategy and market conditions.
❌ Avoid these mistakes and your sales data analysis process becomes a competitive advantage not just a reporting routine.
Conclusion
Sales data analysis is no longer a back-office task, it’s a strategic growth lever for every modern B2B sales team. In today’s complex, fast-moving environment, success depends on your ability to transform raw sales data into actionable insights that drive better forecasting, sharper execution, and stronger sales performance.
Whether you’re identifying at-risk deals, optimizing your sales pipeline, or coaching sales reps based on behavioral patterns, it all starts with data and the discipline to analyze sales consistently and intelligently.
As sales cycles lengthen and teams scale, the use of automation and machine learning will shift from being a differentiator to a requirement. Companies that embrace predictive sales analysis and real-time insights will outpace those that rely solely on instinct and static reports.
Key Takeaways:
✅ Start with accurate, structured, and clean sales data
✅ Choose the right sales analytics software for your team’s needs
✅ Focus on key performance indicators aligned with business goals
✅ Use insights to coach, forecast, and optimize—then track the outcomes
✅ Revisit and evolve your sales analysis process as your strategy matures
FAQs
What is sales data analysis?
Sales data analysis is the process of collecting, organizing, and evaluating sales data to gain valuable insights that inform business decisions. It allows B2B sales teams to understand what’s working, what’s not, and where to improve. By analyzing key performance indicators (KPIs) such as win rates, sales funnel conversion rates, and average deal size, companies can optimize their sales strategies. Sales data analysis is essential for accurate sales forecasting, identifying sales trends, and enhancing overall sales performance.
What does a sales data analysis do?
A sales data analyst is responsible for collecting, cleaning, and interpreting sales data to uncover patterns, trends, and insights that help improve sales performance. They evaluate key metrics like win rate, deal velocity, and sales funnel conversion rates to support strategic decision-making. By using sales analytics software, they build reports and dashboards that help sales managers, sales reps, and marketing teams align their efforts. Sales data analysts also play a key role in predictive sales analysis, supporting more accurate sales forecasting and pipeline health monitoring. In B2B environments, they are essential for turning raw data into actionable insights that drive revenue growth.
How to evaluate sales data?
To evaluate sales data, start by defining your objectives such as improving sales performance or increasing forecast accuracy. Then, gather and clean data from your CRM and related systems, ensuring consistency across key fields like deal stage, amount, and source. Use sales analytics software to run reports that reveal sales trends, conversion rates, and rep activity patterns. Focus on metrics that align with business goals, and avoid vanity metrics that don’t drive action.
What is machine learning in sales?
Machine learning in sales refers to using algorithms to analyze sales data and make accurate predictions about future outcomes, like which deals are likely to close or which customers may churn. It powers predictive sales analysis by detecting patterns in historical sales data and real-time signals. ML applications in sales include lead scoring, win prediction, sales forecasting, and next-best action recommendations. These insights help sales teams improve efficiency, coach reps, and make data-driven decisions.
Share:


