
Top-Down vs Bottom-Up Forecasting: Which Is Right for Your Sales?

Dmytro Chervonyi
CMO at Forecastio
Last updated
Reading time
10 min
Share:
Share
Master time-series forecasting with Forecastio

Why This Matters
In today's competitive B2B landscape, selecting the right approach to sales forecasting can mean the difference between hitting your targets and missing by wide margins. Recent data shows that companies using a hybrid forecasting model are 37% more likely to consistently achieve their revenue goals compared to those relying on a single approach. When evaluating bottom up forecasting vs top down, it becomes clear that each has unique strengths — and the most resilient companies learn how to combine both.
This comprehensive guide explores the critical differences between top down vs bottom up forecasting, helping you determine which methodology — or combination — best fits your organization's specific needs. By the end, you'll have a clear roadmap for implementing a forecasting system that drives growth and provides a true competitive advantage. With Forecastio’s HubSpot-native sales forecasting platform, revenue teams can operationalize both top down forecasting and bottom up forecasting methods within one workflow, achieving over 95% forecast accuracy and cutting manual work.
The Real Cost of Forecasting Failures
Inaccurate sales forecasting isn't just frustrating, it's expensive. According to a recent study by Forrester, organizations with poor forecasting accuracy experience:
26% higher sales and marketing costs due to misaligned resource allocation
18% longer sales cycles from inefficient pipeline management
31% higher sales team turnover resulting from missed targets and compensation issues
Let's explore three scenarios that illustrate the far-reaching consequences of misaligned forecasting approaches:
Scenario 1: Market Share Erosion
The Situation: A mid-market B2B software company relied exclusively on top-down forecasting based on broad market trends. Their optimistic projections led them to overinvest in certain product lines while ignoring emerging customer needs that were visible in granular sales data.
The Result: While focused on their high-level strategy, a more agile competitor who used bottom-up forecasting identified and capitalized on these emerging needs, capturing 17% of their market share in just two quarters.
Scenario 2: Cash Flow Crisis
The Situation: A growing SaaS company's finance team relied solely on top-down revenue forecasts that projected 40% quarterly growth. Based on these projections, they increased hiring and operational spending but the forecasts failed to account for lengthening sales cycles visible in bottom-up pipeline data.
The Result: When actual revenue came in 28% below projections, the company faced a severe cash flow shortage, forcing emergency cost-cutting measures and derailing their product roadmap by six months.
Scenario 3: Investor Confidence Collapse
The Situation: A Series B startup consistently missed their quarterly targets by 15-25% due to forecasts that didn't reconcile the gap between top-down market projections and bottom-up pipeline realities.
The Result: After three consecutive quarters of missed forecasts, investor confidence eroded, reducing their valuation by 30% and significantly complicating their Series C fundraising efforts.
The root cause in each scenario? A one-dimensional approach to sales forecasting that failed to capture the complete picture of market realities and organizational capabilities. This guide will help you avoid these pitfalls by implementing a more balanced methodology.
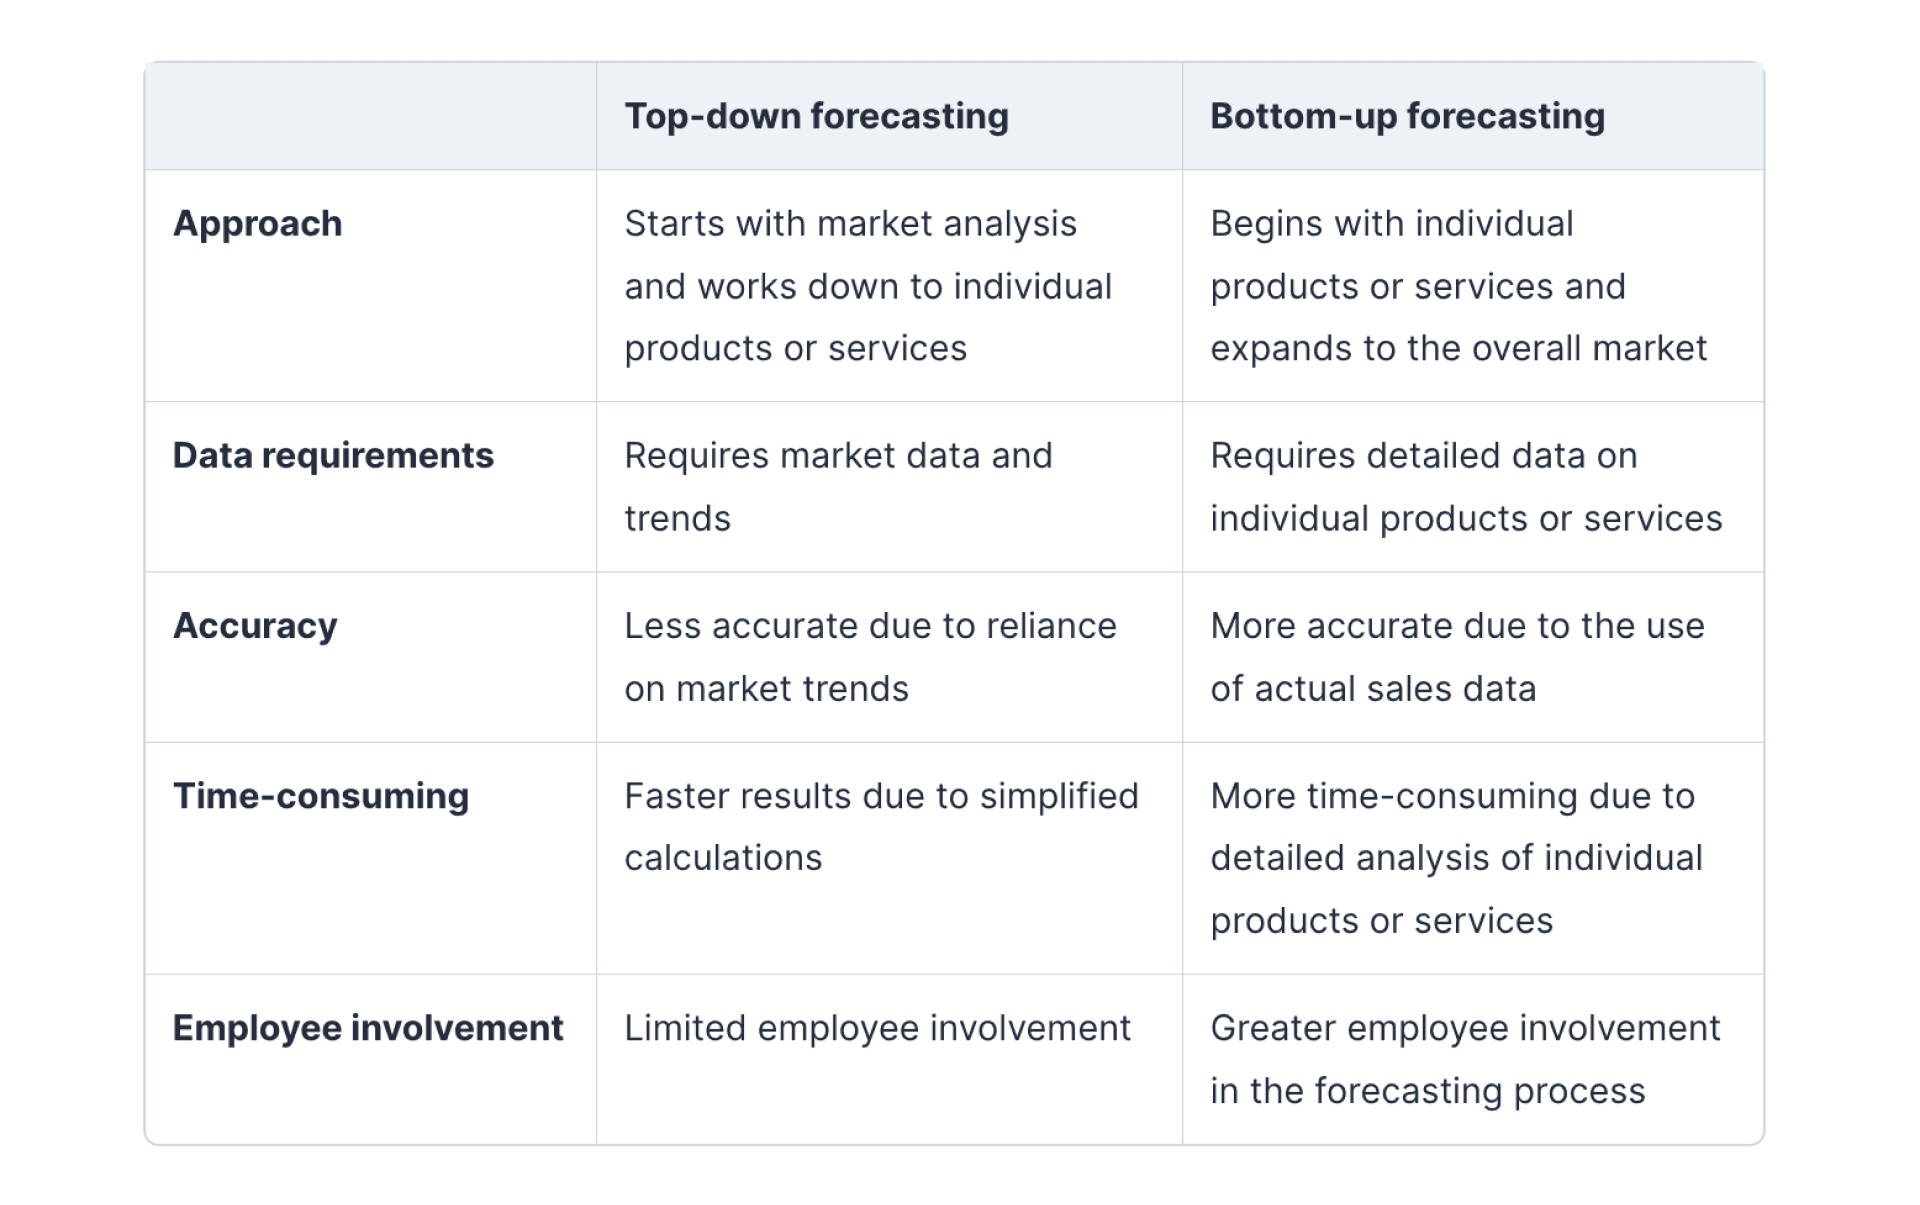
Top-Down vs Bottom-Up Forecasting: The Fundamentals
Before diving into the detailed comparison, let's establish a clear understanding of what each forecasting methodology entails and how they fundamentally differ.
What is Top-Down Forecasting
Top-down forecasting is a sales forecasting method that starts with a high-level revenue target and then breaks that number down across teams, regions, or individual sales reps. Instead of analyzing individual deals or pipeline activity first, leadership defines an overall revenue goal and distributes it throughout the organization.
The top-down approach typically follows this sequence:
Define the overall revenue goal based on company strategy or growth targets
Estimate total market potential and expected market share
Break the target down by region, product line, or sales segment
Allocate quotas to teams and individual sales reps
Track performance and compare results with the assigned targets
Key example: A company plans its annual sales forecast and sets a revenue goal of $50 million based on strategic growth plans and market opportunity. This number is then distributed across regions and teams. For example, North America may receive a $20 million target, Europe $15 million, and the remaining portion allocated to other markets. Sales managers then divide these targets into quotas for individual sales reps.
Top-down forecasting helps align sales forecasting with company strategy and provides clear revenue goals for the organization. However, because it starts with targets rather than real pipeline data, companies often combine it with other forecasting methods to create more realistic revenue projections.
What is Bottom-Up Forecasting?
Bottom-up forecasting takes the opposite approach, building projections from the ground level upward. This methodology relies on detailed analysis of individual sales activities, pipeline stages, and sales rep performance to create an aggregate forecast.
The bottom-up approach typically follows this sequence:
Analyze current pipeline and opportunity details
Apply historical conversion rates by stage, rep, and product
Calculate expected close timelines based on average sales cycles
Aggregate individual projections into team and department forecasts
Combine all elements into a company-wide revenue projection
Key example: When HubSpot forecasts their quarterly revenue, they analyze their pipeline of thousands of opportunities, apply historical win rates by deal size and stage, factor in sales rep performance metrics, and roll these projections up into their overall forecast.
Both approaches offer unique advantages and limitations, which we'll explore thoroughly in the following sections. The key is understanding where each method excels and how they can complement each other in a comprehensive forecasting strategy.
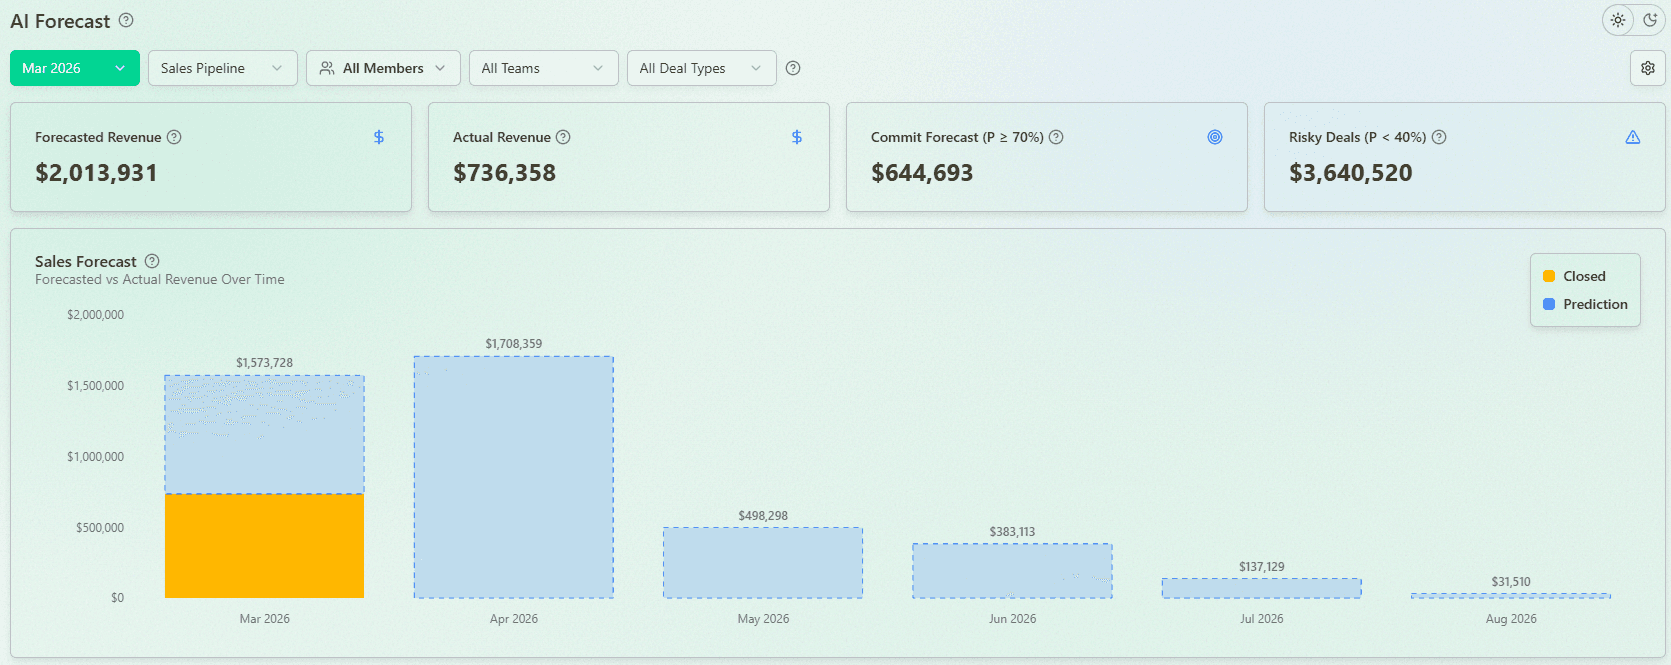
An example of a bottom-up forecast based on open deals and their AI-driven probabilities in Forecastio:
How to Choose Between Top-Down and Bottom-Up Forecasting
Selecting the optimal forecasting approach isn't about finding the single "best" method—it's about matching the right approach to your specific business context and needs. Use this strategic decision framework to guide your selection process.
The Forecasting Method Decision Matrix
Business Factor | Favor Top-Down When... | Favor Bottom-Up When... |
|---|---|---|
Business Maturity | Early-stage with limited historical data | Established with rich sales history and patterns |
Market Stability | Stable, predictable market conditions | Volatile, rapidly changing market dynamics |
Sales Cycle Length | Shorter, transactional sales cycles | Longer, complex enterprise sales processes |
Product Portfolio | Limited product lines with similar characteristics | Diverse offerings across different segments |
Data Availability | Strong market research but limited internal data | Rich CRM data with detailed sales activity tracking |
Organizational Structure | Centralized decision-making culture | Distributed teams with specialized market knowledge |
Planning Purpose | Long-term strategic planning (1-3 years) | Short-term tactical forecasting (next quarter) |
5 Key Questions to Guide Your Selection
Ask these critical questions to determine which approach aligns best with your current business realities:
How mature is your sales data collection?
If you have rich historical data on win rates, sales cycles, and conversion metrics by stage, bottom-up forecasting becomes significantly more valuable.What's your primary forecasting timeframe?
Top-down methods typically work better for longer-term strategic forecasts, while bottom-up excels at shorter-term operational forecasting.How dynamic is your market environment?
In rapidly changing markets, bottom-up approaches often detect emerging trends faster through front-line sales interactions.What's your forecasting confidence level today?
If your current forecasts regularly miss by >15%, you likely need to incorporate the methodology you're not currently using.What resources can you dedicate to forecasting?
Bottom-up forecasting typically requires more robust data infrastructure and analysis capabilities than top-down approaches.
Remember that these approaches aren't mutually exclusive. Many organizations find that implementing both methodologies and reconciling the differences produces the most accurate and actionable forecasts—a strategy we'll explore in detail later in this guide.
Top-Down Forecasting: The Strategic View from Above
Top-down forecasting starts with the macro view of your market and business objectives, then cascades downward to specific operational targets. This approach provides strategic alignment but must be implemented carefully to avoid oversimplified projections.
How Top-Down Forecasting Works: The 5-Step Process
Market Analysis: Determine total addressable market size and growth trajectory
Share Calculation: Estimate a realistic market share based on competitive position
Trend Application: Apply historical patterns and seasonality to projections
Goal Distribution: Allocate targets across products, regions, and teams
Reality Checking: Validate projections against operational capabilities
Key Components of Effective Top-Down Forecasting
A robust top-down forecasting model incorporates these essential elements:
Market size and growth analysis: Utilizing credible third-party research and industry benchmarks
Historical performance trends: Analyzing year-over-year patterns and seasonal variations
Competitive landscape assessment: Evaluating market share movements and competitor trajectories
Economic indicators: Incorporating relevant macroeconomic factors that impact your industry
Strategic initiatives: Accounting for planned marketing campaigns and product launches
Top-Down Forecasting Strengths: When It Shines
✅ Strategic Alignment: Ensures sales targets connect directly to organizational objectives and market realities
✅ Efficiency: Requires less granular data, making it faster to implement with fewer resources
✅ Big-Picture Perspective: Provides the broad market context that bottom-up approaches often miss
✅ New Market Entry: Invaluable when historical sales data doesn't exist for new products or territories
✅ Executive Buy-In: Often resonates better with C-suite stakeholders who think in terms of market strategy
Top-Down Forecasting Limitations: Where It Falls Short
❌ Lack of Granularity: May miss important nuances in specific customer segments or product lines
❌ Potential for Overestimation: Can lead to overly optimistic projections without operational reality checks
❌ Limited Sales Team Input: Often excludes valuable front-line perspectives and ownership
❌ Market Assumption Dependency: Quality is only as good as the market research it's built upon
❌ Rigidity: Can be slow to detect emerging trends or market shifts visible at the sales level
Real-World Example: Top-Down Forecasting for New Market Entry
When Salesforce expanded into the APAC region, they employed a sophisticated top-down forecasting approach:
They analyzed the total CRM software market in each target country
Evaluated competitive positioning and calculated potential market share
Applied growth trajectories from similar regional expansions in Europe
Distributed targets across product lines and industry verticals
Set quotas for newly hired regional sales teams based on these projections
This approach provided the strategic framework needed for a market where they had limited historical sales data, allowing them to set realistic expectations and resource allocations from the start.
Pro Tip: Top-down forecasting works best when refreshed quarterly with actual performance data, allowing for continuous adjustment of assumptions and projections.
Bottom-Up Forecasting: Building Prediction from Pipeline Reality
Bottom-up sales forecasting takes the granular approach, constructing projections from detailed operational data rather than high-level market assumptions. This methodology delivers precision and accountability but requires robust data collection systems.
The Bottom-Up Forecasting Process: 6 Essential Steps
Pipeline Analysis: Catalog all active opportunities by stage, size, and probability
Conversion Application: Apply historical win rates and stage progression metrics
Timeline Calculation: Estimate close dates based on average sales cycle by deal type
Rep Adjustment: Modify projections based on individual rep performance patterns
Aggregation: Roll up individual opportunity forecasts to team and department levels
Sanity Check: Validate against historical performance and market conditions
Core Components of Effective Bottom-Up Forecasting
A comprehensive bottom-up forecasting model incorporates these critical elements:
Detailed opportunity analysis: Stage, size, product mix, and customer type
Historical win rates: Conversion percentages by stage, product, and sales rep
Sales cycle metrics: Average time spent in each stage by deal type
Rep performance data: Individual track records and current productivity metrics
Customer segment insights: Buying patterns and conversion variations by industry or company size
Bottom-Up Forecasting Strengths: Where It Excels
✅ Precision: Provides more accurate short-term forecasts based on actual pipeline activity
✅ Accountability: Creates ownership and engagement across the sales organization
✅ Adaptability: Quickly reflects changes in customer behavior or market conditions
✅ Coaching Insights: Identifies specific performance issues and improvement opportunities
✅ Operational Alignment: Connects directly to day-to-day sales activities and processes
Bottom-Up Forecasting Limitations: What to Watch For
❌ Time-Intensive: Requires significant effort to gather and analyze detailed pipeline data
❌ Data Dependency: Quality is directly tied to the accuracy of CRM data and sales team input
❌ Potential Myopia: May miss broader market trends or shifts visible only at macro level
❌ Scalability Challenges: Can become unwieldy for very large organizations or diverse product lines
❌ Historical Bias: May overweight past patterns that might not predict future performance
Real-World Example: Bottom-Up Forecasting for Process Optimization
When HubSpot wanted to improve forecast accuracy and sales efficiency, they implemented a sophisticated bottom-up approach:
They analyzed win rates and conversion metrics at each pipeline stage
Identified significant variances in performance between different sales teams
Discovered that deals with technical validation calls in early stages had 2× higher close rates
Implemented process changes to incorporate these calls earlier in the sales cycle
Improved overall forecast accuracy by 22% while increasing conversion rates by 15%
This data-driven approach allowed them to not only predict outcomes more accurately but also identify specific process improvements that drove better results.
Pro Tip: The quality of bottom-up forecasting is directly tied to your CRM data hygiene. Invest in systems and training that ensure consistent, accurate data entry from your sales team.
How AI and Machine Learning Improve Bottom-Up Forecasting
One of the biggest challenges with bottom-up forecasting is accuracy. Traditional models often rely on manual inputs, static stage probabilities, and rep-by-rep judgment. This works, but only to a point. AI and machine learning forecasting make bottom-up models far more reliable because they evaluate everything at the deal level and learn from real historical patterns instead of assumptions.
With AI sales forecasting, the system looks at hundreds of signals - deal activity, rep behavior, close-date changes, buying stages, product mix, deal velocity, win/loss patterns, and more. It then assigns dynamic deal probabilities and applies forecasting models at different layers: deals, pipelines, individual reps, teams, and the entire organization. This creates a bottom-up forecast that is data-driven, consistent, and much harder to distort with optimism or gut feel.
Key Advantages of Using AI and Machine Learning in Bottom-Up Forecasting
More accurate deal probabilities because the model learns from real outcomes, not static assumptions.
Consistent forecasting across reps and teams, reducing bias and personal interpretation.
Better prediction of timing, because ML can estimate the most likely close month for each deal.
Improved pipeline visibility, with clear indicators of which deals are healthy and which are at risk.
Scalable forecasting logic, applied across deals, segments, and teams without extra manual work.
Faster recalibration, since the model continuously adjusts based on past errors and new data.
Stronger bottom-up rollups, because every layer of the forecast is built on real deal-level insights.
AI doesn't replace bottom-up forecastingб it makes it significantly more accurate, more objective, and easier to maintain as your pipeline grows.
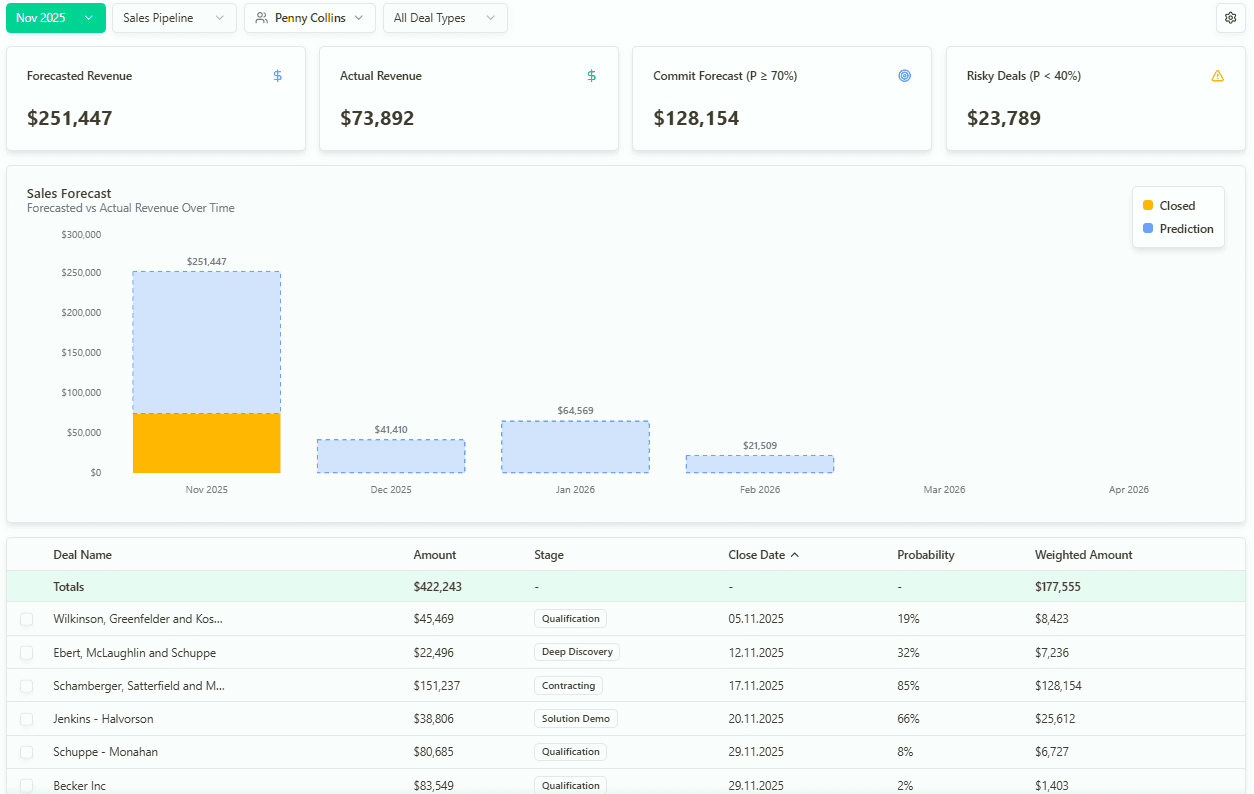
AI-generated forecast and deal probabilities for sales rep Penny Collins
Top-Down vs Bottom-Up Forecasting: Head-to-Head Comparison
Understanding the distinct advantages and limitations of each approach is crucial for determining the optimal forecasting strategy for your organization. This comprehensive comparison highlights the key differences between top-down and bottom-up forecasting methodologies.
Comprehensive Methodology Comparison
Aspect | Top-Down Forecasting | Bottom-Up Forecasting |
|---|---|---|
Starting Point | Market size and trends | Pipeline and opportunity data |
Primary Data Sources | Market research, industry reports | CRM data, sales rep input |
Time Horizon | Typically long-term (1-3 years) | Typically short-term (1-4 quarters) |
Accuracy Timeline | More accurate for long-range planning | More accurate for near-term projections |
Implementation Speed | Faster to implement initially | Requires more setup and data infrastructure |
Required Resources | Market analysis tools and expertise | Robust CRM system and data analytics |
Organizational Alignment | Connects to executive and strategic vision | Connects to sales operations and tactics |
Flexibility | Less adaptable to rapid market changes | Quickly reflects changing conditions |
Ownership Level | Typically owned by executive leadership | Shared ownership across sales organization |
Best For | New markets, strategic planning | Operational forecasting, performance management |
Impact on Key Business Functions
Understanding how each forecasting approach affects different business functions can help you anticipate cross-departmental implications:
Business Function | Top-Down Impact | Bottom-Up Impact |
|---|---|---|
Sales Leadership | Provides strategic targets but may seem disconnected from reality | Offers actionable insights but may lack strategic context |
Finance | Aligns with strategic planning but may lack operational detail | Provides detailed projections but may fluctuate frequently |
Product Development | Helps identify market opportunities at macro level | Surfaces specific customer needs and pain points |
Marketing | Informs broad positioning and messaging strategy | Highlights specific messaging that resonates with current pipeline |
HR/Recruiting | Drives long-term capacity planning | Informs immediate hiring needs based on pipeline load |
Which Industries Favor Each Approach?
While any organization can benefit from either approach, certain industries tend to favor one method based on their business characteristics:
Industries that often favor top-down forecasting:
Consumer packaged goods with stable market shares
Utilities with predictable consumption patterns
Manufacturing with long production planning cycles
Financial services with established market segments
Industries that often favor bottom-up forecasting:
Enterprise software with complex, lengthy sales cycles
Professional services with project-based revenue
Commercial real estate with deal-specific economics
Medical devices with regulatory approval dependencies
The ideal approach for most organizations is to implement both methodologies and reconcile the differences—a strategy we'll explore in the next section.
The Hybrid Approach: Combining Top-Down and Bottom-Up for Maximum Accuracy
While top-down and bottom-up forecasting each have their strengths, the most successful sales organizations implement a hybrid approach that leverages the advantages of both methodologies while minimizing their limitations.
Why the Hybrid Model Delivers Superior Results
A Harvard Business Review study found that companies using a reconciled hybrid forecasting approach achieved:
24% higher forecast accuracy compared to those using a single methodology
18% improvement in resource allocation efficiency
21% better alignment between sales and other business functions
The hybrid approach creates a "forecast triangulation" that provides multiple perspectives on future performance, highlighting discrepancies that might indicate blind spots in either method.
The 7-Step Framework for Implementing Hybrid Forecasting
Follow this proven implementation framework to create a robust hybrid forecasting system:
1. Start with Independent Forecasts
Generate separate top-down and bottom-up forecasts using the methodologies outlined earlier in this guide. Maintain complete independence between the two processes to ensure unbiased results.
2. Identify Variance Areas
Compare the two forecasts to identify areas of significant deviation. Common variance points include:
Specific product lines or services
Geographic regions or territories
Customer segments or industries
Time periods (particular months or quarters)
3. Analyze Variance Root Causes
For each significant variance, investigate potential causes:
Does the top-down approach miss important pipeline realities?
Does the bottom-up method ignore important market trends?
Are there data quality issues in either approach?
Are assumptions outdated or inaccurate?
4. Determine the More Reliable Methodology for Each Segment
Based on your analysis, decide which approach likely provides more accuracy for each business segment:
New products might rely more on top-down market analysis
Established product lines might favor bottom-up pipeline data
Longer sales cycles might benefit from bottom-up tracking
New market entries might require top-down market sizing
5. Create a Reconciliation Process
Establish a formal reconciliation meeting that brings together stakeholders from sales, finance, and executive leadership to review variances and agree on final numbers. This process should:
Follow a consistent cadence (typically monthly)
Use standardized variance analysis reports
Document reconciliation decisions and rationales
Assign follow-up actions for data improvements
6. Implement Continuous Improvement
Track forecast accuracy over time to identify systematic biases in either approach:
Which methodology has been more accurate historically?
Are there consistent patterns in the variances?
How can data quality be improved for both approaches?
7. Leverage Technology for Scale
Modern forecasting platforms like Forecastio can automate much of this process, simultaneously running both methodologies and highlighting variances that require human review.
Common Pitfalls of Hybrid Forecasting and How to Avoid Them
While powerful, hybrid forecasting comes with its own set of challenges:
Data Overload: The combination of approaches can generate overwhelming information
Solution: Focus on key metrics and significant variances rather than attempting to analyze everything
Conflicting Forecasts: Major discrepancies can create organizational confusion
Solution: Establish clear decision rights for forecast reconciliation
Process Complexity: Maintaining dual forecasting systems requires additional resources
Solution: Automate where possible and focus human analysis on variances and insights
Overcorrection: Teams may overreact to variances between methodologies
Solution: Track forecast accuracy over time to identify which approach is more reliable for different segments
When implemented correctly, hybrid forecasting provides the most complete and accurate picture of future performance, combining strategic vision with operational reality.
Why Many Companies Combine Top-Down and Bottom-Up Forecasting
Many B2B companies use both top-down and bottom-up forecasting because each method solves a different problem. Top-down forecasting helps leadership teams align revenue targets with market opportunity and business strategy, while bottom-up forecasting provides realistic projections based on pipeline activity and deal-level data.
Combining both approaches helps organizations balance strategic planning with operational accuracy, reduce forecasting bias, and identify gaps between company targets and real pipeline conditions.
Beyond Spreadsheets: Modern Technology for Forecast Excellence
The complexity of today's sales environments demands more sophisticated forecasting tools than spreadsheets and basic CRM systems can provide. Modern forecasting platforms automate the combination of top-down and bottom-up methodologies while providing powerful analytics and visualization capabilities.
The Evolution of Forecasting Technology
Forecasting tools have evolved dramatically over the past decade:
First Generation: Spreadsheet-Based Forecasting
Manual data entry and calculation
Prone to formula errors and version control issues
Limited collaboration and real-time updating
Minimal analytical capabilities
Second Generation: CRM-Integrated Forecasting
Basic pipeline roll-ups within CRM platforms
Simple weighted probability calculations
Limited historical analysis and trend detection
Basic reporting and visualization
Third Generation: Dedicated Forecasting Platforms
AI-powered predictive analytics
Simultaneous top-down and bottom-up methodology support
Automated variance detection and reconciliation
Advanced scenario modeling capabilities
Real-time integration with multiple data sources
How AI and Machine Learning Are Transforming Forecasting Accuracy
Modern forecasting platforms leverage artificial intelligence and machine learning to deliver capabilities impossible with traditional methods:
Pattern Detection: AI can identify subtle correlations and trends in historical data that human analysts would miss
Deal Risk Assessment: Machine learning algorithms can flag at-risk opportunities based on engagement patterns and deal progression
Rep Performance Prediction: AI can forecast individual rep performance based on historical patterns and current activity levels
Scenario Modeling: Advanced algorithms can simulate multiple market scenarios and their impact on forecasted results
Continuous Learning: Modern systems improve over time by incorporating actual results into their predictive models
Forecasting Technology Selection Framework
When evaluating forecasting platforms, assess these critical capabilities:
Capability | Questions to Ask |
|---|---|
Methodology Support | Does it support both top-down and bottom-up approaches? Can it reconcile differences between them? |
Data Integration | Does it connect natively to your CRM and other data sources? How automated is the data flow? |
AI/ML Capabilities | What specific predictive features does it offer? How does it handle pattern detection and anomaly identification? |
Usability | Is it accessible to both sales leaders and reps? How intuitive are the interfaces and workflows? |
Customization | Can it adapt to your specific sales process and terminology? How configurable are the reports and dashboards? |
Scenario Planning | Can it model different scenarios and assumptions? How easy is it to compare alternative forecasts? |
Implementation | What's the typical implementation timeline? What resources are required from your team? |
Cost Structure | What's the pricing model? Are there hidden costs for integration or additional users? |
Why Forecastio Excels for Modern Sales Organizations
Forecastio's forecasting platform is specifically designed to address the challenges of modern B2B sales organizations:
Unmatched Accuracy: By combining AI algorithms with HubSpot data integration, Forecastio delivers forecasts that are consistently 15-30% more accurate than standard CRM forecasting methods.
Methodology Flexibility: Forecastio supports both top-down time-series analysis and bottom-up pipeline forecasting, automatically reconciling differences between approaches.
Time and Resource Savings: Automated data collection and analysis eliminates manual spreadsheet work, saving sales leaders 5-7 hours per week on forecasting activities.
Adaptive Learning: With machine learning at its core, Forecastio's forecasting models continuously improve, learning from your specific business patterns and market dynamics.
Actionable Insights: Beyond just numbers, Forecastio provides specific recommendations to improve sales performance and address pipeline risks before they impact results.
By leveraging modern forecasting technology, you can implement the hybrid top-down/bottom-up approach without the administrative burden that would make it impractical with manual methods.
Transform Your Forecasting Strategy: Next Steps to Revenue Precision
Throughout this guide, we've explored the fundamental differences between top-down vs bottom-up forecasting, the advantages of a hybrid approach, and the transformative potential of modern forecasting technology.
Key Takeaways for Immediate Implementation
As you evaluate your current forecasting process, consider these critical insights:
Methodology Matters: Neither top-down nor bottom-up forecasting alone provides a complete picture—the most successful organizations implement a hybrid approach
Process Over Tools: While technology can automate and enhance forecasting, the underlying methodology and reconciliation process are what truly drive accuracy
Data Quality is Critical: The reliability of any forecasting approach depends fundamentally on the quality and completeness of your data sources
Continuous Refinement: Forecasting excellence is an ongoing journey, requiring regular evaluation of accuracy and adjustments to your methodology
The Cost of Inaction vs. The Value of Improvement
Research from Gartner indicates that:
Companies with poor forecast accuracy (>20% variance) experience an average of 4% lower annual revenue growth compared to industry peers
Each 5% improvement in forecast accuracy correlates with a 3% increase in win rates on new opportunities
Sales organizations with highly accurate forecasts (±5% variance) achieve 7% higher quota attainment across their teams
These numbers illustrate the significant financial impact of forecasting excellence—and the cost of maintaining the status quo.
Your Path to Forecasting Excellence
Based on your current forecasting maturity, consider these recommended next steps:
If you're using only top-down forecasting: Begin collecting and analyzing detailed pipeline data to provide the ground-level perspective your process is missing.
If you're using only bottom-up forecasting: Incorporate market analysis and competitive intelligence to provide the strategic context that may be absent from your pipeline-based projections.
If you're using a manual hybrid approach: Explore how modern forecasting technology can automate the data collection and reconciliation process, freeing your team to focus on insights rather than administration.
If you're struggling with forecasting accuracy: Consider a comprehensive assessment of your current process, identifying specific gaps and improvement opportunities.
Experience the Future of Sales Forecasting
Forecastio helps B2B sales organizations implement the hybrid forecasting approach described in this guide—without the complexity and manual effort traditionally required.
Our platform connects directly to your HubSpot CRM, automatically applies both top-down and bottom-up methodologies, and provides actionable insights that drive revenue growth.
What You'll Discover in Your Personalized Demo:
How your current forecasting approach compares to industry best practices
Specific accuracy improvements you can expect based on your historical data
The potential revenue impact of enhanced forecasting precision
A clear implementation roadmap customized to your business needs
Book Your Personalized Forecasting Assessment →
Don't let forecasting limitations constrain your growth potential. Join the innovative B2B companies leveraging Forecastio to transform their approach to revenue prediction and realization.
Frequently Asked Questions: Top-Down vs Bottom-Up Forecasting
What is the main difference between top-down and bottom-up forecasting?
The primary difference between top-down vs bottom-up forecasting is their starting point and approach. Top-down forecasting begins with market analysis and company objectives, then works downward to set targets. Bottom-up forecasting starts with detailed pipeline and sales activity data, building upward to create aggregate projections. Top-down provides strategic alignment but may miss operational details, while bottom-up offers precision but might lack market context.
Is top-down or bottom-up forecasting better?
Neither top-down nor bottom-up forecasting is inherently "better"—each has distinct advantages for different situations. Top-down forecasting excels for strategic planning, new market entry, and long-term projections. Bottom-up forecasting delivers superior results for operational planning, performance management, and near-term accuracy. Most successful organizations implement a hybrid approach that leverages the strengths of both methodologies while mitigating their respective weaknesses.
What are the pros and cons of top-down forecasting?
The advantages of top-down forecasting include strategic alignment with business goals, efficiency in implementation, and valuable market context. Its limitations include potential lack of granularity, risk of overestimation from excessive optimism, and limited engagement from sales teams. Top-down forecasting works best for strategic planning, new markets without historical data, and organizations with stable, predictable sales patterns.
What are the pros and cons of bottom-up forecasting?
Bottom-up forecasting provides more precise near-term projections, creates team accountability, and adapts quickly to changing conditions. However, it requires significant time investment, may develop tunnel vision that misses market trends, and depends heavily on CRM data quality. Bottom-up forecasting excels in organizations with complex sales cycles, diverse product portfolios, and strong data collection practices.
How do you implement a hybrid forecasting approach?
To implement a hybrid forecasting approach, start by developing separate top-down and bottom-up forecasts independently. Then identify areas of significant variance between the two projections and analyze the root causes of these differences. Create a formal reconciliation process involving stakeholders from sales, finance, and executive leadership. Finally, track forecast accuracy over time to continually refine your methodology. Modern forecasting platforms like Forecastio can automate much of this process.
What is bottom-up analysis in market sizing?
Bottom-up analysis in market sizing builds from specific, granular data points to create an aggregate market estimate. For example, calculating the total market for a B2B software product by multiplying the number of potential customer companies by average deal size and estimated penetration rates. This contrasts with top-down market sizing, which starts with overall industry size and narrows down by applying relevant percentages and segmentation.
How does top-down sales forecasting work for SaaS companies?
For SaaS companies, top-down sales forecasting typically begins with analyzing the total addressable market (TAM) for their software category. The process then involves estimating realistic market share based on competitive positioning, applying growth rates from similar companies, and distributing targets across customer segments and sales territories. This approach works particularly well for new product launches or market expansions where historical sales data may be limited.
What is the bottom-up method for forecasting sales?
The bottom-up method for forecasting sales analyzes the current pipeline of opportunities, applies historical conversion rates and sales cycle data, and aggregates these projections into a comprehensive forecast. This approach typically includes examining each deal's stage, size, and specific characteristics; calculating probabilities based on historical patterns; estimating close dates; and combining these individual projections into team, regional, and company-wide forecasts.
How can technology improve forecasting accuracy?
Modern forecasting technology can dramatically improve accuracy by automating data collection, applying AI to identify patterns and risks, simultaneously running both top-down and bottom-up methodologies, detecting variances that require investigation, and continuously learning from actual results. Platforms like Forecastio integrate directly with CRM systems, eliminating manual data handling while providing advanced analytics and visualization capabilities that would be impossible with traditional spreadsheet-based approaches.
How often should sales forecasts be updated?
Best practice is to refresh sales forecasts weekly, with more comprehensive reviews conducted monthly and quarterly. Weekly updates should focus on pipeline changes and deal progression, while monthly reviews should reconcile top-down and bottom-up projections. Quarterly sessions should include more thorough analysis of forecast accuracy and methodology refinements. Modern forecasting platforms like Forecastio can automate these updates through real-time CRM integration, ensuring your forecasts always reflect the latest sales activity.
Why This Matters
In today's competitive B2B landscape, selecting the right approach to sales forecasting can mean the difference between hitting your targets and missing by wide margins. Recent data shows that companies using a hybrid forecasting model are 37% more likely to consistently achieve their revenue goals compared to those relying on a single approach. When evaluating bottom up forecasting vs top down, it becomes clear that each has unique strengths — and the most resilient companies learn how to combine both.
This comprehensive guide explores the critical differences between top down vs bottom up forecasting, helping you determine which methodology — or combination — best fits your organization's specific needs. By the end, you'll have a clear roadmap for implementing a forecasting system that drives growth and provides a true competitive advantage. With Forecastio’s HubSpot-native sales forecasting platform, revenue teams can operationalize both top down forecasting and bottom up forecasting methods within one workflow, achieving over 95% forecast accuracy and cutting manual work.
The Real Cost of Forecasting Failures
Inaccurate sales forecasting isn't just frustrating, it's expensive. According to a recent study by Forrester, organizations with poor forecasting accuracy experience:
26% higher sales and marketing costs due to misaligned resource allocation
18% longer sales cycles from inefficient pipeline management
31% higher sales team turnover resulting from missed targets and compensation issues
Let's explore three scenarios that illustrate the far-reaching consequences of misaligned forecasting approaches:
Scenario 1: Market Share Erosion
The Situation: A mid-market B2B software company relied exclusively on top-down forecasting based on broad market trends. Their optimistic projections led them to overinvest in certain product lines while ignoring emerging customer needs that were visible in granular sales data.
The Result: While focused on their high-level strategy, a more agile competitor who used bottom-up forecasting identified and capitalized on these emerging needs, capturing 17% of their market share in just two quarters.
Scenario 2: Cash Flow Crisis
The Situation: A growing SaaS company's finance team relied solely on top-down revenue forecasts that projected 40% quarterly growth. Based on these projections, they increased hiring and operational spending but the forecasts failed to account for lengthening sales cycles visible in bottom-up pipeline data.
The Result: When actual revenue came in 28% below projections, the company faced a severe cash flow shortage, forcing emergency cost-cutting measures and derailing their product roadmap by six months.
Scenario 3: Investor Confidence Collapse
The Situation: A Series B startup consistently missed their quarterly targets by 15-25% due to forecasts that didn't reconcile the gap between top-down market projections and bottom-up pipeline realities.
The Result: After three consecutive quarters of missed forecasts, investor confidence eroded, reducing their valuation by 30% and significantly complicating their Series C fundraising efforts.
The root cause in each scenario? A one-dimensional approach to sales forecasting that failed to capture the complete picture of market realities and organizational capabilities. This guide will help you avoid these pitfalls by implementing a more balanced methodology.
Top-Down vs Bottom-Up Forecasting: The Fundamentals
Before diving into the detailed comparison, let's establish a clear understanding of what each forecasting methodology entails and how they fundamentally differ.
What is Top-Down Forecasting
Top-down forecasting is a sales forecasting method that starts with a high-level revenue target and then breaks that number down across teams, regions, or individual sales reps. Instead of analyzing individual deals or pipeline activity first, leadership defines an overall revenue goal and distributes it throughout the organization.
The top-down approach typically follows this sequence:
Define the overall revenue goal based on company strategy or growth targets
Estimate total market potential and expected market share
Break the target down by region, product line, or sales segment
Allocate quotas to teams and individual sales reps
Track performance and compare results with the assigned targets
Key example: A company plans its annual sales forecast and sets a revenue goal of $50 million based on strategic growth plans and market opportunity. This number is then distributed across regions and teams. For example, North America may receive a $20 million target, Europe $15 million, and the remaining portion allocated to other markets. Sales managers then divide these targets into quotas for individual sales reps.
Top-down forecasting helps align sales forecasting with company strategy and provides clear revenue goals for the organization. However, because it starts with targets rather than real pipeline data, companies often combine it with other forecasting methods to create more realistic revenue projections.
What is Bottom-Up Forecasting?
Bottom-up forecasting takes the opposite approach, building projections from the ground level upward. This methodology relies on detailed analysis of individual sales activities, pipeline stages, and sales rep performance to create an aggregate forecast.
The bottom-up approach typically follows this sequence:
Analyze current pipeline and opportunity details
Apply historical conversion rates by stage, rep, and product
Calculate expected close timelines based on average sales cycles
Aggregate individual projections into team and department forecasts
Combine all elements into a company-wide revenue projection
Key example: When HubSpot forecasts their quarterly revenue, they analyze their pipeline of thousands of opportunities, apply historical win rates by deal size and stage, factor in sales rep performance metrics, and roll these projections up into their overall forecast.
Both approaches offer unique advantages and limitations, which we'll explore thoroughly in the following sections. The key is understanding where each method excels and how they can complement each other in a comprehensive forecasting strategy.
An example of a bottom-up forecast based on open deals and their AI-driven probabilities in Forecastio:
How to Choose Between Top-Down and Bottom-Up Forecasting
Selecting the optimal forecasting approach isn't about finding the single "best" method—it's about matching the right approach to your specific business context and needs. Use this strategic decision framework to guide your selection process.
The Forecasting Method Decision Matrix
Business Factor | Favor Top-Down When... | Favor Bottom-Up When... |
|---|---|---|
Business Maturity | Early-stage with limited historical data | Established with rich sales history and patterns |
Market Stability | Stable, predictable market conditions | Volatile, rapidly changing market dynamics |
Sales Cycle Length | Shorter, transactional sales cycles | Longer, complex enterprise sales processes |
Product Portfolio | Limited product lines with similar characteristics | Diverse offerings across different segments |
Data Availability | Strong market research but limited internal data | Rich CRM data with detailed sales activity tracking |
Organizational Structure | Centralized decision-making culture | Distributed teams with specialized market knowledge |
Planning Purpose | Long-term strategic planning (1-3 years) | Short-term tactical forecasting (next quarter) |
5 Key Questions to Guide Your Selection
Ask these critical questions to determine which approach aligns best with your current business realities:
How mature is your sales data collection?
If you have rich historical data on win rates, sales cycles, and conversion metrics by stage, bottom-up forecasting becomes significantly more valuable.What's your primary forecasting timeframe?
Top-down methods typically work better for longer-term strategic forecasts, while bottom-up excels at shorter-term operational forecasting.How dynamic is your market environment?
In rapidly changing markets, bottom-up approaches often detect emerging trends faster through front-line sales interactions.What's your forecasting confidence level today?
If your current forecasts regularly miss by >15%, you likely need to incorporate the methodology you're not currently using.What resources can you dedicate to forecasting?
Bottom-up forecasting typically requires more robust data infrastructure and analysis capabilities than top-down approaches.
Remember that these approaches aren't mutually exclusive. Many organizations find that implementing both methodologies and reconciling the differences produces the most accurate and actionable forecasts—a strategy we'll explore in detail later in this guide.
Top-Down Forecasting: The Strategic View from Above
Top-down forecasting starts with the macro view of your market and business objectives, then cascades downward to specific operational targets. This approach provides strategic alignment but must be implemented carefully to avoid oversimplified projections.
How Top-Down Forecasting Works: The 5-Step Process
Market Analysis: Determine total addressable market size and growth trajectory
Share Calculation: Estimate a realistic market share based on competitive position
Trend Application: Apply historical patterns and seasonality to projections
Goal Distribution: Allocate targets across products, regions, and teams
Reality Checking: Validate projections against operational capabilities
Key Components of Effective Top-Down Forecasting
A robust top-down forecasting model incorporates these essential elements:
Market size and growth analysis: Utilizing credible third-party research and industry benchmarks
Historical performance trends: Analyzing year-over-year patterns and seasonal variations
Competitive landscape assessment: Evaluating market share movements and competitor trajectories
Economic indicators: Incorporating relevant macroeconomic factors that impact your industry
Strategic initiatives: Accounting for planned marketing campaigns and product launches
Top-Down Forecasting Strengths: When It Shines
✅ Strategic Alignment: Ensures sales targets connect directly to organizational objectives and market realities
✅ Efficiency: Requires less granular data, making it faster to implement with fewer resources
✅ Big-Picture Perspective: Provides the broad market context that bottom-up approaches often miss
✅ New Market Entry: Invaluable when historical sales data doesn't exist for new products or territories
✅ Executive Buy-In: Often resonates better with C-suite stakeholders who think in terms of market strategy
Top-Down Forecasting Limitations: Where It Falls Short
❌ Lack of Granularity: May miss important nuances in specific customer segments or product lines
❌ Potential for Overestimation: Can lead to overly optimistic projections without operational reality checks
❌ Limited Sales Team Input: Often excludes valuable front-line perspectives and ownership
❌ Market Assumption Dependency: Quality is only as good as the market research it's built upon
❌ Rigidity: Can be slow to detect emerging trends or market shifts visible at the sales level
Real-World Example: Top-Down Forecasting for New Market Entry
When Salesforce expanded into the APAC region, they employed a sophisticated top-down forecasting approach:
They analyzed the total CRM software market in each target country
Evaluated competitive positioning and calculated potential market share
Applied growth trajectories from similar regional expansions in Europe
Distributed targets across product lines and industry verticals
Set quotas for newly hired regional sales teams based on these projections
This approach provided the strategic framework needed for a market where they had limited historical sales data, allowing them to set realistic expectations and resource allocations from the start.
Pro Tip: Top-down forecasting works best when refreshed quarterly with actual performance data, allowing for continuous adjustment of assumptions and projections.
Bottom-Up Forecasting: Building Prediction from Pipeline Reality
Bottom-up sales forecasting takes the granular approach, constructing projections from detailed operational data rather than high-level market assumptions. This methodology delivers precision and accountability but requires robust data collection systems.
The Bottom-Up Forecasting Process: 6 Essential Steps
Pipeline Analysis: Catalog all active opportunities by stage, size, and probability
Conversion Application: Apply historical win rates and stage progression metrics
Timeline Calculation: Estimate close dates based on average sales cycle by deal type
Rep Adjustment: Modify projections based on individual rep performance patterns
Aggregation: Roll up individual opportunity forecasts to team and department levels
Sanity Check: Validate against historical performance and market conditions
Core Components of Effective Bottom-Up Forecasting
A comprehensive bottom-up forecasting model incorporates these critical elements:
Detailed opportunity analysis: Stage, size, product mix, and customer type
Historical win rates: Conversion percentages by stage, product, and sales rep
Sales cycle metrics: Average time spent in each stage by deal type
Rep performance data: Individual track records and current productivity metrics
Customer segment insights: Buying patterns and conversion variations by industry or company size
Bottom-Up Forecasting Strengths: Where It Excels
✅ Precision: Provides more accurate short-term forecasts based on actual pipeline activity
✅ Accountability: Creates ownership and engagement across the sales organization
✅ Adaptability: Quickly reflects changes in customer behavior or market conditions
✅ Coaching Insights: Identifies specific performance issues and improvement opportunities
✅ Operational Alignment: Connects directly to day-to-day sales activities and processes
Bottom-Up Forecasting Limitations: What to Watch For
❌ Time-Intensive: Requires significant effort to gather and analyze detailed pipeline data
❌ Data Dependency: Quality is directly tied to the accuracy of CRM data and sales team input
❌ Potential Myopia: May miss broader market trends or shifts visible only at macro level
❌ Scalability Challenges: Can become unwieldy for very large organizations or diverse product lines
❌ Historical Bias: May overweight past patterns that might not predict future performance
Real-World Example: Bottom-Up Forecasting for Process Optimization
When HubSpot wanted to improve forecast accuracy and sales efficiency, they implemented a sophisticated bottom-up approach:
They analyzed win rates and conversion metrics at each pipeline stage
Identified significant variances in performance between different sales teams
Discovered that deals with technical validation calls in early stages had 2× higher close rates
Implemented process changes to incorporate these calls earlier in the sales cycle
Improved overall forecast accuracy by 22% while increasing conversion rates by 15%
This data-driven approach allowed them to not only predict outcomes more accurately but also identify specific process improvements that drove better results.
Pro Tip: The quality of bottom-up forecasting is directly tied to your CRM data hygiene. Invest in systems and training that ensure consistent, accurate data entry from your sales team.
How AI and Machine Learning Improve Bottom-Up Forecasting
One of the biggest challenges with bottom-up forecasting is accuracy. Traditional models often rely on manual inputs, static stage probabilities, and rep-by-rep judgment. This works, but only to a point. AI and machine learning forecasting make bottom-up models far more reliable because they evaluate everything at the deal level and learn from real historical patterns instead of assumptions.
With AI sales forecasting, the system looks at hundreds of signals - deal activity, rep behavior, close-date changes, buying stages, product mix, deal velocity, win/loss patterns, and more. It then assigns dynamic deal probabilities and applies forecasting models at different layers: deals, pipelines, individual reps, teams, and the entire organization. This creates a bottom-up forecast that is data-driven, consistent, and much harder to distort with optimism or gut feel.
Key Advantages of Using AI and Machine Learning in Bottom-Up Forecasting
More accurate deal probabilities because the model learns from real outcomes, not static assumptions.
Consistent forecasting across reps and teams, reducing bias and personal interpretation.
Better prediction of timing, because ML can estimate the most likely close month for each deal.
Improved pipeline visibility, with clear indicators of which deals are healthy and which are at risk.
Scalable forecasting logic, applied across deals, segments, and teams without extra manual work.
Faster recalibration, since the model continuously adjusts based on past errors and new data.
Stronger bottom-up rollups, because every layer of the forecast is built on real deal-level insights.
AI doesn't replace bottom-up forecastingб it makes it significantly more accurate, more objective, and easier to maintain as your pipeline grows.
AI-generated forecast and deal probabilities for sales rep Penny Collins
Top-Down vs Bottom-Up Forecasting: Head-to-Head Comparison
Understanding the distinct advantages and limitations of each approach is crucial for determining the optimal forecasting strategy for your organization. This comprehensive comparison highlights the key differences between top-down and bottom-up forecasting methodologies.
Comprehensive Methodology Comparison
Aspect | Top-Down Forecasting | Bottom-Up Forecasting |
|---|---|---|
Starting Point | Market size and trends | Pipeline and opportunity data |
Primary Data Sources | Market research, industry reports | CRM data, sales rep input |
Time Horizon | Typically long-term (1-3 years) | Typically short-term (1-4 quarters) |
Accuracy Timeline | More accurate for long-range planning | More accurate for near-term projections |
Implementation Speed | Faster to implement initially | Requires more setup and data infrastructure |
Required Resources | Market analysis tools and expertise | Robust CRM system and data analytics |
Organizational Alignment | Connects to executive and strategic vision | Connects to sales operations and tactics |
Flexibility | Less adaptable to rapid market changes | Quickly reflects changing conditions |
Ownership Level | Typically owned by executive leadership | Shared ownership across sales organization |
Best For | New markets, strategic planning | Operational forecasting, performance management |
Impact on Key Business Functions
Understanding how each forecasting approach affects different business functions can help you anticipate cross-departmental implications:
Business Function | Top-Down Impact | Bottom-Up Impact |
|---|---|---|
Sales Leadership | Provides strategic targets but may seem disconnected from reality | Offers actionable insights but may lack strategic context |
Finance | Aligns with strategic planning but may lack operational detail | Provides detailed projections but may fluctuate frequently |
Product Development | Helps identify market opportunities at macro level | Surfaces specific customer needs and pain points |
Marketing | Informs broad positioning and messaging strategy | Highlights specific messaging that resonates with current pipeline |
HR/Recruiting | Drives long-term capacity planning | Informs immediate hiring needs based on pipeline load |
Which Industries Favor Each Approach?
While any organization can benefit from either approach, certain industries tend to favor one method based on their business characteristics:
Industries that often favor top-down forecasting:
Consumer packaged goods with stable market shares
Utilities with predictable consumption patterns
Manufacturing with long production planning cycles
Financial services with established market segments
Industries that often favor bottom-up forecasting:
Enterprise software with complex, lengthy sales cycles
Professional services with project-based revenue
Commercial real estate with deal-specific economics
Medical devices with regulatory approval dependencies
The ideal approach for most organizations is to implement both methodologies and reconcile the differences—a strategy we'll explore in the next section.
The Hybrid Approach: Combining Top-Down and Bottom-Up for Maximum Accuracy
While top-down and bottom-up forecasting each have their strengths, the most successful sales organizations implement a hybrid approach that leverages the advantages of both methodologies while minimizing their limitations.
Why the Hybrid Model Delivers Superior Results
A Harvard Business Review study found that companies using a reconciled hybrid forecasting approach achieved:
24% higher forecast accuracy compared to those using a single methodology
18% improvement in resource allocation efficiency
21% better alignment between sales and other business functions
The hybrid approach creates a "forecast triangulation" that provides multiple perspectives on future performance, highlighting discrepancies that might indicate blind spots in either method.
The 7-Step Framework for Implementing Hybrid Forecasting
Follow this proven implementation framework to create a robust hybrid forecasting system:
1. Start with Independent Forecasts
Generate separate top-down and bottom-up forecasts using the methodologies outlined earlier in this guide. Maintain complete independence between the two processes to ensure unbiased results.
2. Identify Variance Areas
Compare the two forecasts to identify areas of significant deviation. Common variance points include:
Specific product lines or services
Geographic regions or territories
Customer segments or industries
Time periods (particular months or quarters)
3. Analyze Variance Root Causes
For each significant variance, investigate potential causes:
Does the top-down approach miss important pipeline realities?
Does the bottom-up method ignore important market trends?
Are there data quality issues in either approach?
Are assumptions outdated or inaccurate?
4. Determine the More Reliable Methodology for Each Segment
Based on your analysis, decide which approach likely provides more accuracy for each business segment:
New products might rely more on top-down market analysis
Established product lines might favor bottom-up pipeline data
Longer sales cycles might benefit from bottom-up tracking
New market entries might require top-down market sizing
5. Create a Reconciliation Process
Establish a formal reconciliation meeting that brings together stakeholders from sales, finance, and executive leadership to review variances and agree on final numbers. This process should:
Follow a consistent cadence (typically monthly)
Use standardized variance analysis reports
Document reconciliation decisions and rationales
Assign follow-up actions for data improvements
6. Implement Continuous Improvement
Track forecast accuracy over time to identify systematic biases in either approach:
Which methodology has been more accurate historically?
Are there consistent patterns in the variances?
How can data quality be improved for both approaches?
7. Leverage Technology for Scale
Modern forecasting platforms like Forecastio can automate much of this process, simultaneously running both methodologies and highlighting variances that require human review.
Common Pitfalls of Hybrid Forecasting and How to Avoid Them
While powerful, hybrid forecasting comes with its own set of challenges:
Data Overload: The combination of approaches can generate overwhelming information
Solution: Focus on key metrics and significant variances rather than attempting to analyze everything
Conflicting Forecasts: Major discrepancies can create organizational confusion
Solution: Establish clear decision rights for forecast reconciliation
Process Complexity: Maintaining dual forecasting systems requires additional resources
Solution: Automate where possible and focus human analysis on variances and insights
Overcorrection: Teams may overreact to variances between methodologies
Solution: Track forecast accuracy over time to identify which approach is more reliable for different segments
When implemented correctly, hybrid forecasting provides the most complete and accurate picture of future performance, combining strategic vision with operational reality.
Why Many Companies Combine Top-Down and Bottom-Up Forecasting
Many B2B companies use both top-down and bottom-up forecasting because each method solves a different problem. Top-down forecasting helps leadership teams align revenue targets with market opportunity and business strategy, while bottom-up forecasting provides realistic projections based on pipeline activity and deal-level data.
Combining both approaches helps organizations balance strategic planning with operational accuracy, reduce forecasting bias, and identify gaps between company targets and real pipeline conditions.
Beyond Spreadsheets: Modern Technology for Forecast Excellence
The complexity of today's sales environments demands more sophisticated forecasting tools than spreadsheets and basic CRM systems can provide. Modern forecasting platforms automate the combination of top-down and bottom-up methodologies while providing powerful analytics and visualization capabilities.
The Evolution of Forecasting Technology
Forecasting tools have evolved dramatically over the past decade:
First Generation: Spreadsheet-Based Forecasting
Manual data entry and calculation
Prone to formula errors and version control issues
Limited collaboration and real-time updating
Minimal analytical capabilities
Second Generation: CRM-Integrated Forecasting
Basic pipeline roll-ups within CRM platforms
Simple weighted probability calculations
Limited historical analysis and trend detection
Basic reporting and visualization
Third Generation: Dedicated Forecasting Platforms
AI-powered predictive analytics
Simultaneous top-down and bottom-up methodology support
Automated variance detection and reconciliation
Advanced scenario modeling capabilities
Real-time integration with multiple data sources
How AI and Machine Learning Are Transforming Forecasting Accuracy
Modern forecasting platforms leverage artificial intelligence and machine learning to deliver capabilities impossible with traditional methods:
Pattern Detection: AI can identify subtle correlations and trends in historical data that human analysts would miss
Deal Risk Assessment: Machine learning algorithms can flag at-risk opportunities based on engagement patterns and deal progression
Rep Performance Prediction: AI can forecast individual rep performance based on historical patterns and current activity levels
Scenario Modeling: Advanced algorithms can simulate multiple market scenarios and their impact on forecasted results
Continuous Learning: Modern systems improve over time by incorporating actual results into their predictive models
Forecasting Technology Selection Framework
When evaluating forecasting platforms, assess these critical capabilities:
Capability | Questions to Ask |
|---|---|
Methodology Support | Does it support both top-down and bottom-up approaches? Can it reconcile differences between them? |
Data Integration | Does it connect natively to your CRM and other data sources? How automated is the data flow? |
AI/ML Capabilities | What specific predictive features does it offer? How does it handle pattern detection and anomaly identification? |
Usability | Is it accessible to both sales leaders and reps? How intuitive are the interfaces and workflows? |
Customization | Can it adapt to your specific sales process and terminology? How configurable are the reports and dashboards? |
Scenario Planning | Can it model different scenarios and assumptions? How easy is it to compare alternative forecasts? |
Implementation | What's the typical implementation timeline? What resources are required from your team? |
Cost Structure | What's the pricing model? Are there hidden costs for integration or additional users? |
Why Forecastio Excels for Modern Sales Organizations
Forecastio's forecasting platform is specifically designed to address the challenges of modern B2B sales organizations:
Unmatched Accuracy: By combining AI algorithms with HubSpot data integration, Forecastio delivers forecasts that are consistently 15-30% more accurate than standard CRM forecasting methods.
Methodology Flexibility: Forecastio supports both top-down time-series analysis and bottom-up pipeline forecasting, automatically reconciling differences between approaches.
Time and Resource Savings: Automated data collection and analysis eliminates manual spreadsheet work, saving sales leaders 5-7 hours per week on forecasting activities.
Adaptive Learning: With machine learning at its core, Forecastio's forecasting models continuously improve, learning from your specific business patterns and market dynamics.
Actionable Insights: Beyond just numbers, Forecastio provides specific recommendations to improve sales performance and address pipeline risks before they impact results.
By leveraging modern forecasting technology, you can implement the hybrid top-down/bottom-up approach without the administrative burden that would make it impractical with manual methods.
Transform Your Forecasting Strategy: Next Steps to Revenue Precision
Throughout this guide, we've explored the fundamental differences between top-down vs bottom-up forecasting, the advantages of a hybrid approach, and the transformative potential of modern forecasting technology.
Key Takeaways for Immediate Implementation
As you evaluate your current forecasting process, consider these critical insights:
Methodology Matters: Neither top-down nor bottom-up forecasting alone provides a complete picture—the most successful organizations implement a hybrid approach
Process Over Tools: While technology can automate and enhance forecasting, the underlying methodology and reconciliation process are what truly drive accuracy
Data Quality is Critical: The reliability of any forecasting approach depends fundamentally on the quality and completeness of your data sources
Continuous Refinement: Forecasting excellence is an ongoing journey, requiring regular evaluation of accuracy and adjustments to your methodology
The Cost of Inaction vs. The Value of Improvement
Research from Gartner indicates that:
Companies with poor forecast accuracy (>20% variance) experience an average of 4% lower annual revenue growth compared to industry peers
Each 5% improvement in forecast accuracy correlates with a 3% increase in win rates on new opportunities
Sales organizations with highly accurate forecasts (±5% variance) achieve 7% higher quota attainment across their teams
These numbers illustrate the significant financial impact of forecasting excellence—and the cost of maintaining the status quo.
Your Path to Forecasting Excellence
Based on your current forecasting maturity, consider these recommended next steps:
If you're using only top-down forecasting: Begin collecting and analyzing detailed pipeline data to provide the ground-level perspective your process is missing.
If you're using only bottom-up forecasting: Incorporate market analysis and competitive intelligence to provide the strategic context that may be absent from your pipeline-based projections.
If you're using a manual hybrid approach: Explore how modern forecasting technology can automate the data collection and reconciliation process, freeing your team to focus on insights rather than administration.
If you're struggling with forecasting accuracy: Consider a comprehensive assessment of your current process, identifying specific gaps and improvement opportunities.
Experience the Future of Sales Forecasting
Forecastio helps B2B sales organizations implement the hybrid forecasting approach described in this guide—without the complexity and manual effort traditionally required.
Our platform connects directly to your HubSpot CRM, automatically applies both top-down and bottom-up methodologies, and provides actionable insights that drive revenue growth.
What You'll Discover in Your Personalized Demo:
How your current forecasting approach compares to industry best practices
Specific accuracy improvements you can expect based on your historical data
The potential revenue impact of enhanced forecasting precision
A clear implementation roadmap customized to your business needs
Book Your Personalized Forecasting Assessment →
Don't let forecasting limitations constrain your growth potential. Join the innovative B2B companies leveraging Forecastio to transform their approach to revenue prediction and realization.
Frequently Asked Questions: Top-Down vs Bottom-Up Forecasting
What is the main difference between top-down and bottom-up forecasting?
The primary difference between top-down vs bottom-up forecasting is their starting point and approach. Top-down forecasting begins with market analysis and company objectives, then works downward to set targets. Bottom-up forecasting starts with detailed pipeline and sales activity data, building upward to create aggregate projections. Top-down provides strategic alignment but may miss operational details, while bottom-up offers precision but might lack market context.
Is top-down or bottom-up forecasting better?
Neither top-down nor bottom-up forecasting is inherently "better"—each has distinct advantages for different situations. Top-down forecasting excels for strategic planning, new market entry, and long-term projections. Bottom-up forecasting delivers superior results for operational planning, performance management, and near-term accuracy. Most successful organizations implement a hybrid approach that leverages the strengths of both methodologies while mitigating their respective weaknesses.
What are the pros and cons of top-down forecasting?
The advantages of top-down forecasting include strategic alignment with business goals, efficiency in implementation, and valuable market context. Its limitations include potential lack of granularity, risk of overestimation from excessive optimism, and limited engagement from sales teams. Top-down forecasting works best for strategic planning, new markets without historical data, and organizations with stable, predictable sales patterns.
What are the pros and cons of bottom-up forecasting?
Bottom-up forecasting provides more precise near-term projections, creates team accountability, and adapts quickly to changing conditions. However, it requires significant time investment, may develop tunnel vision that misses market trends, and depends heavily on CRM data quality. Bottom-up forecasting excels in organizations with complex sales cycles, diverse product portfolios, and strong data collection practices.
How do you implement a hybrid forecasting approach?
To implement a hybrid forecasting approach, start by developing separate top-down and bottom-up forecasts independently. Then identify areas of significant variance between the two projections and analyze the root causes of these differences. Create a formal reconciliation process involving stakeholders from sales, finance, and executive leadership. Finally, track forecast accuracy over time to continually refine your methodology. Modern forecasting platforms like Forecastio can automate much of this process.
What is bottom-up analysis in market sizing?
Bottom-up analysis in market sizing builds from specific, granular data points to create an aggregate market estimate. For example, calculating the total market for a B2B software product by multiplying the number of potential customer companies by average deal size and estimated penetration rates. This contrasts with top-down market sizing, which starts with overall industry size and narrows down by applying relevant percentages and segmentation.
How does top-down sales forecasting work for SaaS companies?
For SaaS companies, top-down sales forecasting typically begins with analyzing the total addressable market (TAM) for their software category. The process then involves estimating realistic market share based on competitive positioning, applying growth rates from similar companies, and distributing targets across customer segments and sales territories. This approach works particularly well for new product launches or market expansions where historical sales data may be limited.
What is the bottom-up method for forecasting sales?
The bottom-up method for forecasting sales analyzes the current pipeline of opportunities, applies historical conversion rates and sales cycle data, and aggregates these projections into a comprehensive forecast. This approach typically includes examining each deal's stage, size, and specific characteristics; calculating probabilities based on historical patterns; estimating close dates; and combining these individual projections into team, regional, and company-wide forecasts.
How can technology improve forecasting accuracy?
Modern forecasting technology can dramatically improve accuracy by automating data collection, applying AI to identify patterns and risks, simultaneously running both top-down and bottom-up methodologies, detecting variances that require investigation, and continuously learning from actual results. Platforms like Forecastio integrate directly with CRM systems, eliminating manual data handling while providing advanced analytics and visualization capabilities that would be impossible with traditional spreadsheet-based approaches.
How often should sales forecasts be updated?
Best practice is to refresh sales forecasts weekly, with more comprehensive reviews conducted monthly and quarterly. Weekly updates should focus on pipeline changes and deal progression, while monthly reviews should reconcile top-down and bottom-up projections. Quarterly sessions should include more thorough analysis of forecast accuracy and methodology refinements. Modern forecasting platforms like Forecastio can automate these updates through real-time CRM integration, ensuring your forecasts always reflect the latest sales activity.
Share:
Dmytro is a seasoned marketing professional with over 10 years in the B2B and startup ecosystem. He is passionate about helping companies better plan their revenue goals, improve forecast accuracy, and proactively address performance bottlenecks or seize growth opportunities.
Dmytro is a seasoned marketing professional with over 10 years in the B2B and startup ecosystem. He is passionate about helping companies better plan their revenue goals, improve forecast accuracy, and proactively address performance bottlenecks or seize growth opportunities.
Related articles

Revenue Operations
May 21, 2026
14 min

May 21, 2026
13 min

Sales Forecasting
May 21, 2026
10 min
Revenue Operations
May 21, 2026
14 min
May 21, 2026
13 min
Revenue Operations
May 21, 2026
14 min
May 21, 2026
13 min
Sales Planning
Sales Forecasting
Sales Performance Insights
Sales Planning
Sales Forecasting
Sales Performance Insights
Sales Planning
Sales Forecasting
Sales Performance Insights


Product
© 2025 Forecastio, All rights reserved.
Sales Planning
Sales Forecasting
Sales Performance Insights
Sales Planning
Sales Forecasting
Sales Performance Insights
Sales Planning
Sales Forecasting
Sales Performance Insights
Product
© 2025 Forecastio, All rights reserved.
Sales Planning
Sales Forecasting
Sales Performance Insights
Sales Planning
Sales Forecasting
Sales Performance Insights
Sales Planning
Sales Forecasting
Sales Performance Insights
Product
© 2025 Forecastio, All rights reserved.