
10 Sales Forecasting Methods for B2B Revenue Teams: Pros, Cons & Use Cases

Alex Zlotko
CEO at Forecastio

Introduction: Why Sales Forecasting Methods Matter
Sales forecasting methods are essential for revenue teams and sales managers who want to plan with confidence, hit ambitious targets, and grow predictably. A strong sales forecast is more than a number - it's the foundation for resource allocation, hiring plans, marketing budgets, and revenue growth strategies. According to Gartner, fewer than 50% of sales leaders are confident in their team's forecasting accuracy, which shows how critical the choice of forecasting model really is.
But not all methods of sales forecasting fit every business model. In B2B sales, the right approach depends on multiple factors - deal size, sales cycle length, sales pipeline complexity, team size, and the quality of historical sales data. A startup with short cycles and smaller deals may benefit from simpler pipeline forecasting, while an enterprise team with long sales cycles often needs AI sales forecasting or multivariable analysis to get highly accurate sales forecasts.
In this guide, we'll walk you through 10 proven sales forecasting methods, breaking down how each one works, its advantages and limitations, and real-world examples with numbers. By the end, you'll know which sales forecasting method best fits your sales model and how to use it to build reliable revenue forecasts. For additional context, check out these real-world sales forecasting examples that show how different techniques are applied in practice.
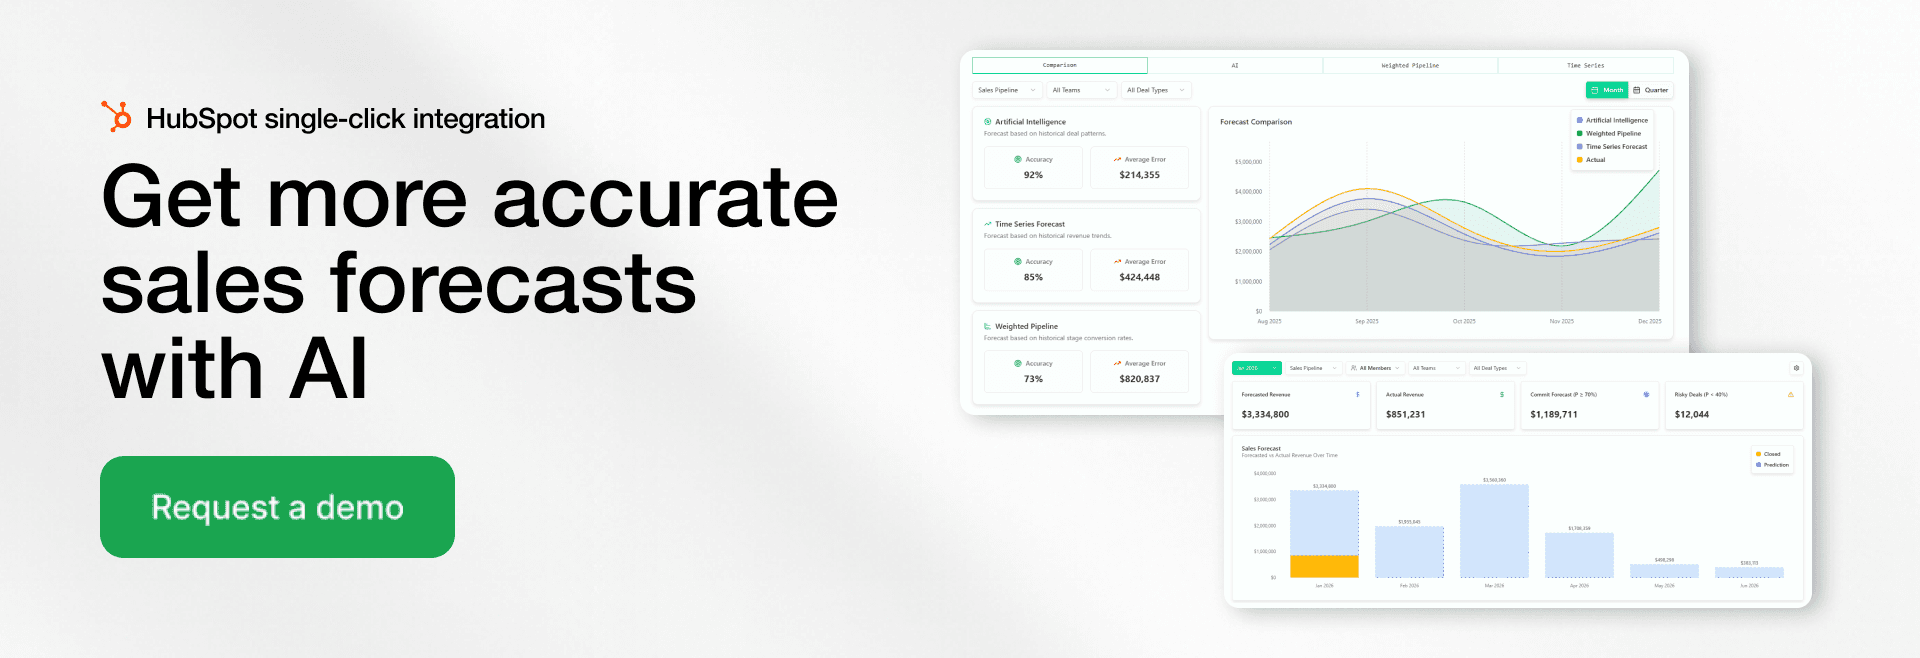
👉 If you want to go even deeper, you can download our comprehensive guide on sales forecasting methods.
What Are Sales Forecasting Methods?
Sales forecasting methods are frameworks businesses use to predict future revenue based on historical sales data, pipeline activity, deal probabilities, sales cycle trends, rep judgment, or AI models.
The most common sales forecasting methods include:
Weighted pipeline forecasting
AI and machine learning forecasting
Historical forecasting
Time series forecasting
Forecast Categories and Submissions
Length of sales cycle forecasting
Regression analysis
Multivariable analysis
Monte Carlo simulation
Test market analysis
The best forecasting method depends on factors such as sales cycle length, data quality, deal complexity, and business model.
How to Choose the Right Sales Forecasting Method
Different sales forecasting methods work better for different sales models.
Sales Model and Data Maturity | Best Sales Forecasting Methods |
|---|---|
SMB / Short Sales Cycles | Weighted Pipeline, Historical Forecasting |
Mid-Market SaaS | Weighted Pipeline, AI Sales Forecasting |
Enterprise B2B Sales | AI Sales Forecasting, Forecast Categories and Submissions |
Recurring Revenue | Time Series Forecasting, Regression Analysis |
Low Data Maturity | Historical Forecasting, Forecast Categories and Submissions |
High Data Maturity | AI Sales Forecasting, Multivariable Analysis |
There is no universal sales forecasting method that works for every business. The right approach depends on factors such as sales cycle complexity, historical sales data quality, pipeline maturity, and deal volume. Many B2B companies combine multiple forecasting methods to improve forecast accuracy across different revenue streams.
Where Forecastio helps:
The reality is that no single method works perfectly in all situations. That's why Forecastio combines multiple forecasting models - from weighted pipeline to AI-driven predictions - and lets sales leaders compare them side by side. Whether you're an SMB looking for simplicity or an enterprise needing highly accurate sales forecasts, Forecastio adapts to your business model and data maturity.
1. Weighted Pipeline Forecasting
What it is:
Weighted pipeline forecasting is one of the most widely used sales forecasting methods because of its simplicity. Each deal in the sales pipeline is assigned a probability of closing based on its stage (Discovery, Proposal, Negotiation, etc.). The forecasted revenue is calculated by multiplying the deal value by this probability and summing across all deals.
Formula:
Forecasted Revenue = ∑ (Deal Value × Stage Probability)
Example:
Imagine your sales team has 10 deals in the Proposal stage, each worth $10,000. If the probability of closing a deal at this stage is 30%, your pipeline forecast would be:
10 × $10,000 × 30% = $30,000 forecasted revenue.
This approach helps sales leaders quickly predict future sales based on past conversion rates between stages.
Best fit:
SMBs and mid-market sales teams
Short sales cycles (1-3 months)
Companies with a predictable and disciplined sales process
Pros:
Simple and fast to calculate
Provides a clear view of pipeline health
Cons:
Doesn't consider deal-specific factors (e.g., deal size, industry, buyer behavior)
Less accurate for long or complex B2B sales cycles
Stat insight: According to CSO Insights, 74% of sales organizations still rely on weighted pipeline forecasting, but fewer than 50% achieve forecast accuracy higher than 75%.
Weighted Pipeline vs AI Sales Forecasting
Weighted pipeline forecasting uses fixed stage probabilities to estimate future revenue, while AI forecasting analyzes multiple deal-level signals such as activity, sales cycle behavior, and historical patterns. Weighted pipeline forecasting works well for SMB sales teams with shorter cycles, while AI forecasting is usually more accurate for enterprise B2B sales with longer and more complex deal cycles.
Where Forecastio helps:
Instead of relying on fixed percentages, Forecastio enhances weighted pipeline forecasting by using historical sales data and AI to automatically adjust stage probabilities. This helps sales leaders generate more accurate sales forecasts without the guesswork.

Figure 1. Forecastio automatically calculates pipeline stage probabilities

2. AI & Machine Learning Forecasting
What it is:
AI sales forecasting is transforming how sales leaders create accurate sales forecasts. Instead of relying only on static probabilities or historical sales forecasting, this approach uses advanced algorithms to analyze dozens of variables at once - far beyond what a human manager could track manually. A machine learning model studies past sales data, identifies patterns in how deals progress, and applies these insights to predict the likelihood of future wins.
For example, AI can evaluate deal behavior (e.g., how many days a deal has been in a stage), team activity (emails, meetings, calls), customer attributes (company size, industry, region), and even external factors like seasonality or market trends. Unlike traditional sales forecasting methods, machine learning models constantly adapt as more real-time data flows in, meaning the forecasts become smarter and more accurate over time.
Example:
Imagine an enterprise B2B sales team running hundreds of opportunities simultaneously. An ML model processes more than 50 variables, such as:
Number of stakeholder meetings logged by sales reps
Deal age compared to the average sales cycle length
Industry segment and company size
Past win rates for similar accounts
The output might look like this: Deal A has a 72% probability of closing. If that deal is worth $10,000, the system adds $7,200 to the forecast. Deal B, with a 40% probability, contributes $4,000 of its $10,000 value. When applied across the sales pipeline, this creates a far more accurate forecasting model than static weighted stages.
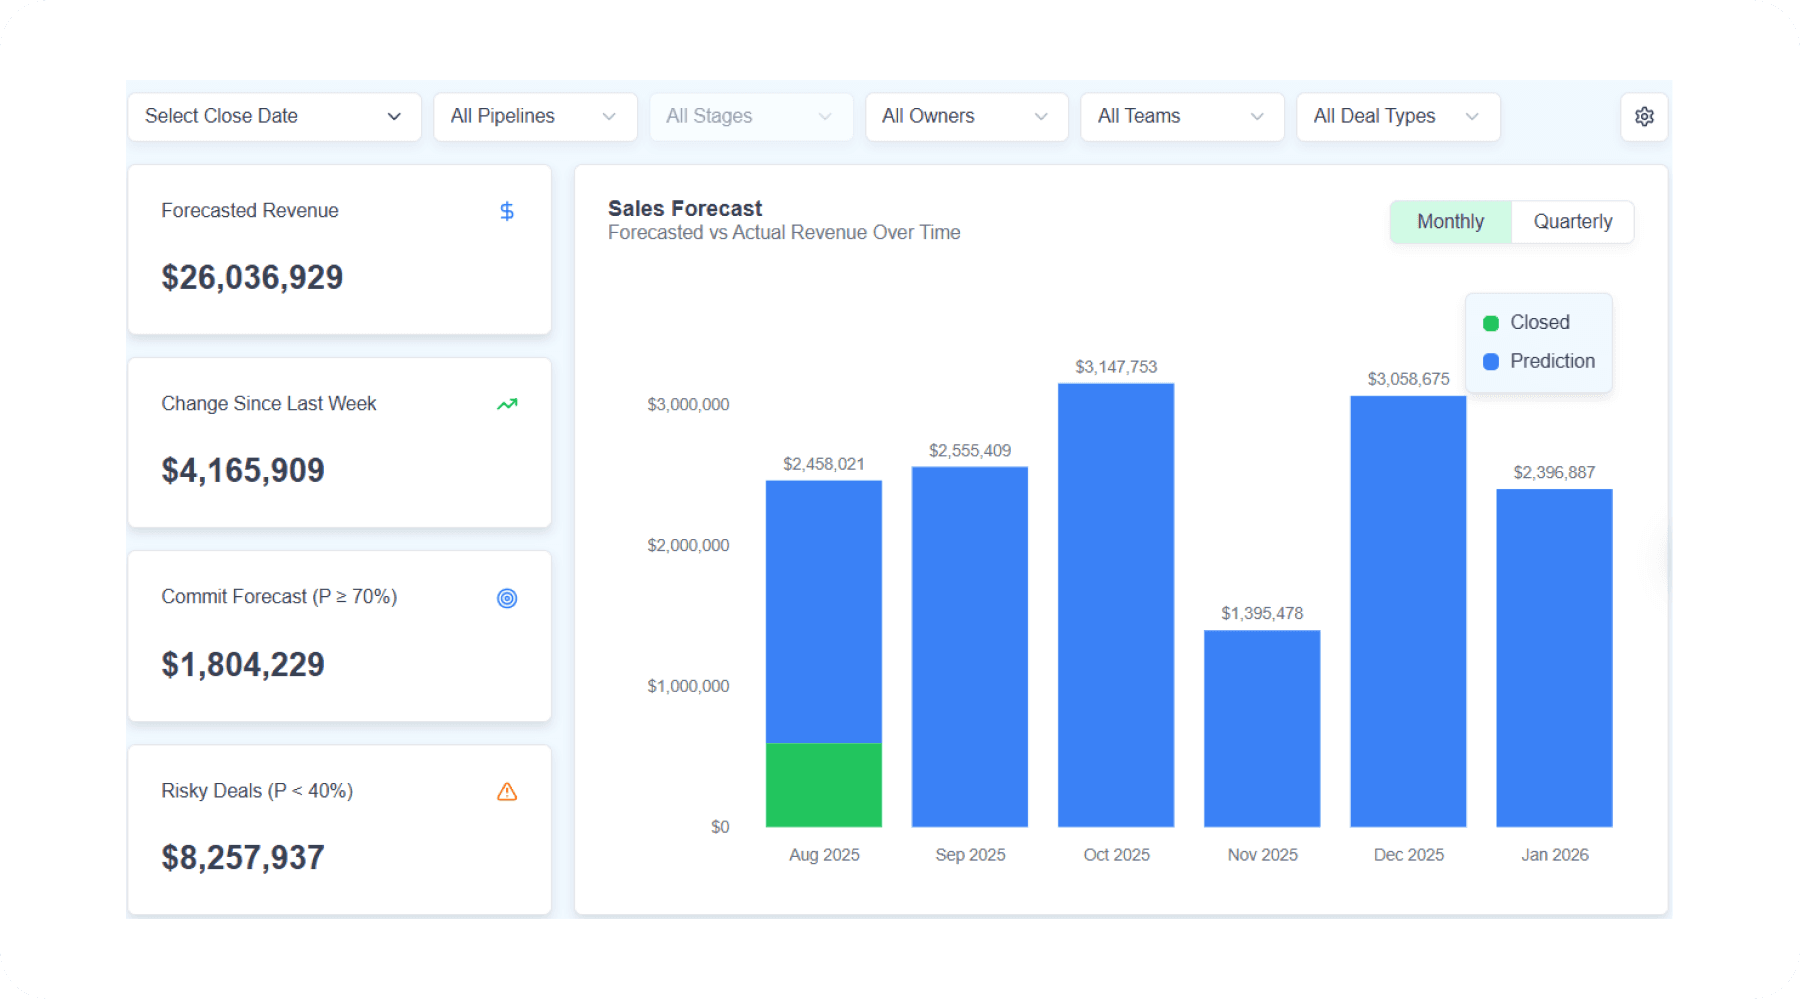
Figure 2. AI Forecast in Forecastio
Best fit:
Large sales teams (10+ sales reps)
Complex or enterprise B2B sales cycles with multiple stakeholders
Companies with several years of clean historical sales data
Organizations seeking to improve forecast accuracy beyond what static methods can achieve
Pros:
Delivers highly accurate forecasts compared to traditional forecasting models
Analyzes multiple signals that impact future revenue
Learns and adapts continuously, improving with more reliable data
Cons:
Requires a large volume of clean, consistent sales data to train the models
Can feel like a "black box," making it hard for sales leaders to explain forecasts to executives
More expensive and resource-intensive to implement compared to simpler sales forecasting methods
Stat insight: McKinsey research shows that companies using AI sales forecasting can improve forecast accuracy by up to 50%, leading to better resource allocation and more predictable growth.
Predicting the Most Probable Month of Closing
In AI sales forecasting, predicting only the overall chance of winning a deal is not enough. To achieve strong sales forecasting accuracy, the model must also estimate the most probable month the deal will close. These are two completely different probabilities: the probability of winning the deal at all, and the probability of closing it within a specific time period. Any sales forecasting method that ignores the timing component risks creating an accurate sales forecast on paper but an unreliable one in practice, because revenue may shift into a later month or even the next quarter.
Predicting close dates accurately is crucial because it helps teams:
Set realistic monthly and quarterly targets
Understand what revenue is actually at risk
Avoid late surprises when deals slip
Plan hiring, budgeting, and headcount based on expected timing
Improve scenario planning and cash flow forecasting
Align expectations between sales, finance, and leadership
When AI models predict both if a deal will close and when it’s most likely to happen, sales leaders get a much clearer picture of pipeline reliability and can operate with far more confidence.
Is AI Sales Forecasting More Accurate?
AI sales forecasting is often more accurate than traditional forecasting methods because it analyzes multiple variables simultaneously, including pipeline activity, deal behavior, historical win rates, and sales cycle trends. However, AI forecasting still depends heavily on CRM data quality and sales process consistency.
Where Forecastio helps
Forecastio uses AI sales forecasting to analyze pipeline health, deal risk, and sales cycle length automatically. Instead of manually adjusting probabilities, sales leaders get real-time insights and highly accurate sales forecasts powered by machine learning - without needing a data science team. Also, Forecastio allows teams to run what-if scenarios. For example, you can exclude deals below a certain probability threshold and see how the final forecast number will be affected.

Figure 3. What-if scenarios in Forecastio

3. Historical Forecasting
What it is:
Historical forecasting is one of the oldest and simplest sales forecasting methods. It relies on the assumption that past sales trends are a good predictor of future sales. By looking at historical revenue data - such as the average revenue over the last 3, 6, or 12 months - sales leaders can forecast sales for the next period.
This method works best when a business has stable sales cycles, consistent demand, and low variability in deal size. For example, subscription-based SaaS companies, manufacturing businesses with repeat orders, or retail companies with predictable seasonal demand often rely on this sales forecasting model.
However, while this approach is simple and intuitive, it ignores what is actually happening in the sales pipeline today and does not factor in market dynamics or sudden changes in customer behavior.
Example:
Imagine you want to forecast sales for July using the average monthly revenue from the last six months:
Month | Actual Revenue |
January | $95,000 |
February | $100,000 |
March | $92,000 |
April | $105,000 |
May | $98,000 |
June | $110,000 |
Average revenue (last 6 months) = $100,000
Forecast for July = $100,000
This approach uses past sales data to create a baseline, but it does not account for new deals entering the pipeline or external factors like economic conditions.
Best fit:
Stable businesses with repeatable, recurring revenue
Companies with low variability in deal size
Early-stage forecasting when the pipeline is small or unreliable
Pros:
Very simple and easy to explain to stakeholders
No need for complex systems or heavy data requirements
Provides a quick benchmark for revenue forecasts
Cons:
Ignores the current sales pipeline and deals in progress
Fails to detect changes in performance, future demand, or market trends
Can mislead sales teams during rapid growth or downturns
Stat insight: Research by InsightSquared shows that 65% of sales leaders using only historical forecasting miss their quarterly targets, largely because the method doesn't adapt to current conditions.
Historical Forecasting vs Time Series Forecasting
Historical forecasting relies on past averages to predict future sales, while time series forecasting analyzes trends, seasonality, and recurring revenue patterns over time. Time series models usually produce more accurate forecasts for SaaS and subscription businesses with strong historical sales data.
4. Time Series Forecasting (e.g., ARIMA)
What it is:
Time series forecasting is a statistical sales forecasting method that analyzes historical sales data over time to detect recurring patterns, seasonality, and long-term trends. Unlike simpler models that look only at averages, time series forecasting takes into account how your sales revenue changes month by month or quarter by quarter.
For example, if your SaaS business typically grows 5% month over month but experiences a drop every December due to holiday slowdowns, a time series model will capture this seasonal trend. One of the most popular models is ARIMA (Autoregressive Integrated Moving Average), which is powerful for analyzing and predicting revenue when you have a long history of past sales data.
This method requires at least 24-48 months of consistent data to produce accurate forecasts. The more historical revenue data you have, the better the model can predict future demand and revenue trends.
Example:
Imagine a SaaS company tracks MRR (Monthly Recurring Revenue) for four years. The model detects:
5% month-over-month growth trend
Seasonal dip of -10% every December
Quarterly spikes due to annual renewals
Using these signals, the model can project next year's revenue with a higher level of forecast accuracy compared to simple averages or weighted pipeline methods.
Best fit:
Businesses with at least 2-4 years of historical data
Recurring revenue models (e.g., SaaS, subscriptions)
Finance or CFO-level planning for long-term strategy
Pros:
Captures seasonality, cycles, and growth trends
Great for long-term projections and strategic planning
Provides more reliable forecasts than simple averages
Cons:
Requires clean, consistent data
Demands statistical expertise or sales forecasting software with built-in models
Less effective if your business is young or your sales process is still volatile
Stat insight: According to Forrester, companies using advanced statistical forecasting models like ARIMA improve forecast accuracy by 20-30% compared to traditional methods.
Where Forecastio helps:
Forecastio supports time series forecasting alongside pipeline-based and AI-driven methods.This allows sales leaders to combine historical forecasting with real-time pipeline insights, resulting in highly accurate sales forecasts that align with both short-term sales cycles and long-term strategic planning.
5. Forecast Categories and Submissions
What it is:
Qualitative forecasting often depends on human judgment and rep confidence. For many teams, this takes the form of understanding forecast categories such as Pipeline, Best Case, and Commit, which help structure manual forecasts.
Commit-based forecasting is a human-driven sales forecasting method where reps and managers place every open deal into a forecast category and then "commit" a number for the period. The categories create a common language for the sales team and finance, while the commit captures human judgment. Most B2B teams use three working buckets plus Closed Won:
Pipeline: all qualified open opportunities that could close this period. No promise yet.
Best Case: deals that have a realistic path to close if things go well (executive access, budget confirmed, timeline aligned).
Commit: deals the rep and manager agree will close this period barring an unexpected event. These are inspected in detail and often require notes on risks, next steps, and mutual close plans.
Closed Won: revenue already booked for the period.
Finance usually treats Commit + Closed Won as the company's "management forecast," while Best Case shows upside. Pipeline helps capacity planning and pipeline hygiene, not the headline number. This approach brings human context that pure models miss, which is why many enterprises keep it as a layer even if they also run AI sales forecasting or weighted pipeline.
Example:
Category | Amount |
Pipeline | $520,000 |
Best Case | $260,000 |
Commit | $180,000 |
Closed-Won | $40,000 |
Management forecast (Commit + Closed Won) = $220,000
Upside scenario (Best Case + Closed Won) = $300,000
Full pipeline view remains $520,000 for coverage checks and pipeline forecast discussions.
Roll-ups happen by layer (Rep → Manager → Region → Company). Managers often adjust rep commits after risk reviews, executive alignment checks, or slips.
Best for:
Large B2B teams with layered reviews and sales cycle forecasting
Orgs with strong accountability and note discipline
Late-stage validation to pressure-test an AI or weighted forecast
Pros:
Brings human judgment and customer context into the sales forecast
Flexible across segments and sales motions
Easy for finance to read (clear definitions of Pipeline, Best Case, Commit)
Cons:
Prone to optimism bias and sandbagging if not audited
Hard to scale without definitions, gates, and manager inspection
No single formula, so consistency depends on operating cadence and data quality
How to make it accurate:
Define entry/exit criteria for each category and enforce them in the CRM.
Require deal notes: decision process, date, mutual close plan, risks.
Lock commits before month-end and track changes with an audit trail.
Compare Commit vs actuals every period to coach for forecast accuracy.
👉 Want to balance human judgment with data-driven models? Book a demo of Forecastio
Forecast Categories vs Weighted Pipeline Forecasting
Commit forecasting depends on human judgment and rep confidence, while weighted pipeline forecasting relies on predefined probabilities tied to pipeline stages. Commit forecasting provides valuable context for complex enterprise deals, but weighted pipeline forecasting is typically more scalable and consistent for larger sales organizations.
6. Length of Sales Cycle Forecasting
What it is:
Length of sales cycle forecasting is a sales forecasting method that predicts the likelihood of a deal closing based on how long it has been in the pipeline compared to the company's average B2B sales cycle length. Instead of relying only on stage probabilities or rep judgment, this approach looks at actual time in cycle.
For example, if your average sales cycle is 60 days and a deal has already been open for 40 days, the model assumes it is roughly two-thirds of the way toward closing. This makes the method particularly useful for businesses with steady sales cycles and well-defined deal progression.
This approach is essentially a timing-based forecast, helping sales leaders anticipate future revenue by monitoring deal "age" relative to benchmarks from historical sales data. It's simple to calculate but requires consistent pipeline discipline and reliable CRM data entry.
Example:
Deal | Value | Days Open | Avg Cycle (days) | Estimated Probability | Forecast Contribution |
A | $20,000 | 20 | 60 | 33% | $6,600 |
B | $15,000 | 40 | 60 | 67% | $10,050 |
C | $30,000 | 60 | 60 | 100% | $30,000 |
Total Forecast = $46,650
This example shows how each deal's time in cycle determines its probability and contribution to the forecast.
Best fit:
Businesses with consistent sales cycle forecasting length
Teams that want to track opportunity-level forecasts
Companies with strong pipeline discipline and reliable data
Pros:
Easy to calculate and explain
Uses real timing data rather than guesswork
Works well when cycle times are predictable
Cons:
Ignores the quality or risk factors of individual deals
Not reliable for long, irregular, or complex B2B sales cycles
Fails to account for external factors like competition or market shifts
Stat insight: Studies show that companies tracking sales cycle forecasting length improve pipeline visibility and can cut sales cycle times by up to 18% by identifying deals that stall too long.
7. Regression Analysis Forecasting
What it is:
Regression analysis forecasting is a sales forecasting method that looks at the relationship between sales performance and other influencing variables. Instead of focusing only on historical averages or pipeline stages, regression uses statistical models to identify which factors have the strongest impact on sales.
For example, sales revenue might depend not only on the number of open deals, but also on marketing spend, pricing changes, seasonality, economic indicators, or sales team activity levels. By analyzing how these variables correlate with past results, regression analysis helps sales leaders predict future sales under different conditions.
This approach is particularly valuable for companies that want to understand the drivers behind sales growth - not just the outcome. Unlike simpler forecasting models, regression can reveal how much a factor like "10% more qualified leads" or "increasing discount rates" influences the final sales forecast.
Example:
A SaaS company wants to forecast next quarter's sales using two variables: number of demos booked and average deal size.
Quarter | Demos Booked | Avg Deal Size | Actual Sales |
Q1 | 200 | $5,000 | $950,000 |
Q2 | 240 | $5,200 | $1,200,000 |
Q3 | 180 | $5,500 | $1,000,000 |
Q4 | 220 | $5,400 | $1,150,000 |
After running regression, the model finds that:
Every 10 additional demos add about $50,000 in revenue
Every $100 increase in deal size adds about $20,000 in revenue
Using this relationship, sales leaders can forecast sales more accurately by plugging in expected demo numbers and deal sizes for the next quarter.
Best fit:
Businesses with strong historical data and multiple internal and external factors influencing sales
Sales teams with varying deal sizes or demand drivers
Companies that want to connect sales performance to marketing or market conditions
Pros:
Identifies which factors drive sales outcomes
Helps leaders adjust strategy (e.g., invest in more demos or marketing campaigns)
Produces more reliable forecasts than simple historical averages
Cons:
Requires statistical knowledge or advanced sales forecasting software
Can become overly complex with too many variables
Forecast quality depends heavily on data accuracy and consistency
Stat insight: Harvard Business Review reports that companies using regression-based forecasting models improved revenue prediction accuracy by up to 20%, especially when multiple demand drivers were considered.
8. Multivariable Analysis Forecasting
What it is:
Multivariable analysis is one of the most advanced sales forecasting methods, designed for companies where sales outcomes are influenced by multiple factors at once. Unlike single-variable approaches such as historical forecasting or length of sales cycle forecasting, this method considers a combination of pipeline data, sales activities, and external conditions to generate more accurate forecasts.
In practice, this type of sales forecasting model pulls information from both your CRM and external sources, then weighs each factor's impact on revenue. For example, while pipeline forecast data might show $1M in opportunities, the model also considers how much sales rep activity, deal size variability, and even market trends affect the likelihood of closing that revenue.
Possible variables in a multivariable analysis forecast include:
Number of new opportunities created
Current stage and age of deals in the sales pipeline
Sales rep activity (calls, emails, meetings logged)
Win rates by product or segment
Historical performance of similar accounts
Economic indicators such as interest rates or inflation
Seasonality and recurring patterns in demand
Market research signals like competitor pricing changes
Marketing campaign performance (MQL → SQL conversions)
Average discount level applied to deals
By combining these factors, businesses can predict future sales more reliably than using just one input. This method is particularly effective for mid-sized to enterprise organizations that need highly accurate sales forecasts across multiple products, regions, or customer segments.

Figure 4. Most common variables in multivariable analysis
Best fit:
Mid-market and enterprise B2B sales teams
Companies with diverse revenue streams or multiple sales motions
Organizations with clean data and the ability to track multiple KPIs
Pros:
Produces more reliable forecasts by considering both internal and external factors
Reduces dependence on a single variable like historical averages or pipeline probabilities
Helps sales leaders understand the interplay between pipeline activity, rep behavior, and market dynamics
Cons:
Requires large volumes of historical sales data
More complex to implement without strong sales forecasting software
Quality depends on the consistency and accuracy of input data
Regression Analysis vs Multivariable Forecasting
Regression analysis usually focuses on understanding the relationship between sales revenue and a limited number of variables, while multivariable forecasting combines many internal and external factors simultaneously. Multivariable forecasting is often better suited for enterprise revenue operations with more complex sales environments.
9. Monte Carlo Simulation Forecasting
What it is:
Monte Carlo simulation is one of the most advanced sales forecasting methods, often used in finance and risk management but increasingly applied to sales. Instead of producing a single forecast number, it runs thousands of simulations on your sales pipeline to model a range of possible outcomes. Each simulation varies inputs such as win rates, deal sizes, and sales cycle length, creating a probability distribution of results.
For example, rather than saying "we will close $2M this quarter," a Monte Carlo simulation might tell you there's a 70% chance of closing at least $1.8M, a 50% chance of closing $2M, and a 20% chance of exceeding $2.2M. This approach gives sales leaders and CFOs a much deeper understanding of both risk and upside in the forecast.
Monte Carlo is particularly powerful when pipeline performance is volatile or when leaders want to stress-test revenue forecasts under different assumptions, such as lower win rates or longer cycle times.

Figure 5. Monte Carlo Sales Forecasting Simulation Process
Best fit:
Enterprise B2B sales teams with large, complex pipelines
CFOs and revenue leaders who want to evaluate risk vs. upside
Strategic planning where understanding forecast confidence matters
Pros:
Provides a range of outcomes, not just a single point forecast
Captures uncertainty in win rates, deal size, and cycle length
Helps sales leaders make better resource allocation decisions
Cons:
Requires strong historical data to set realistic input ranges
Computationally more complex than most forecasting models
May feel overly technical for sales reps or frontline managers
10. Test Market Analysis Forecasting
What it is:
Test market analysis forecasting is one of the more experimental sales forecasting methods, often used when launching a new product or entering a new market. Instead of relying on historical sales data or existing pipeline metrics, a company releases its product in a limited test market and uses actual results to predict future sales at scale.
For example, a software company planning to expand into Germany might first run a three-month pilot in a single city, track conversion rates, deal sizes, and sales cycle length, and then apply those insights to build a forecast for the entire German market. Similarly, a consumer goods company may introduce a new product in one region, measure early adoption, and use those numbers to project national or global sales.
This method is particularly valuable when no reliable past data exists, such as new product categories, disruptive innovations, or entry into unfamiliar geographies. The key is ensuring the test market is representative of the larger audience - otherwise, results may not translate accurately.
Best fit:
New product launches with no prior sales history
Companies entering new markets or geographies
Businesses wanting to validate assumptions before scaling
Pros:
Based on real customer behavior, not assumptions
Provides early insights into future demand
Useful for go-to-market validation alongside other forecasting models
Cons:
Costly and time-consuming to run tests
Results may not always scale (regional differences, competitive dynamics)
Less useful for established businesses with strong historical forecasting models
Stat insight: Nielsen research shows that 65% of new product launches fail within the first year due to poor demand estimation. Running structured test markets before full rollout significantly increases forecast accuracy and reduces risk.
Which Sales Forecasting Method Is Most Accurate?
The most accurate sales forecasting method depends on the sales model, pipeline complexity, and data quality. For enterprise B2B sales with large pipelines and long sales cycles, AI sales forecasting and multivariable analysis often produce the highest forecasting accuracy because they analyze multiple deal-level signals simultaneously.
For SMB sales teams with shorter and more predictable sales cycles, weighted pipeline forecasting and historical forecasting may be sufficient. Companies with recurring revenue models often achieve strong results with time series forecasting.
In practice, many B2B organizations combine several sales forecasting methods to improve forecast accuracy across different revenue streams and sales motions.
Why You Need to Combine Different Sales Forecasting Methods
A single sales forecasting method is rarely enough. Different revenue streams, sales motions, and deal types behave differently and require different forecasting approaches. Combining methods often leads to more accurate and more reliable forecasts.
You typically need to combine sales forecasting methods when:
You forecast both new business and renewals
New business with long and complex sales cycles benefits from AI and ML–based deal probability models, while renewals and expansions are often forecast more accurately using time series analysis based on historical patterns.You have multiple sales motions
Enterprise and strategic deals usually require advanced AI-driven forecasting to account for deal risk, slippage, and changing close dates. Transactional sales or PLG motions tend to be more predictable and often perform better with simpler, volume-based or time series models.Sales cycle length varies significantly
Long sales cycles introduce uncertainty that AI and ML models handle better. Short sales cycles with high deal volume typically benefit from historical trend analysis and seasonality modeling.Different teams manage different types of pipeline
Account executives working large deals may rely on AI-assisted forecasts, while account management or customer success teams can use historical data to forecast renewals more accurately.
The key principle is straightforward. Forecasting improves when organizations apply the right forecasting method to the right revenue stream, instead of forcing a single approach across the entire business.
Can You Combine Multiple Sales Forecasting Methods?
Yes. Most mature B2B organizations combine multiple sales forecasting methods rather than relying on a single model. For example, companies often use AI forecasting for enterprise opportunities, time series forecasting for renewals, and weighted pipeline forecasting for transactional sales. Combining forecasting methods usually improves forecast accuracy because different revenue streams behave differently.
Measure Forecast Accuracy by Method
Using different sales forecasting methods is useful only if you compare how accurate each one is over time.
For example, one team may find that weighted pipeline forecasting works reasonably well for SMB deals, while AI sales forecasting performs much better for enterprise opportunities. Another team may discover that time series forecasting is highly reliable for renewals, but weak for new business.
This is why sales leaders should track forecast accuracy by method, segment, and period. When you measure which forecasting model performs best in each context, you stop debating opinions and start building a forecasting system based on evidence.
How Do You Measure Forecast Accuracy?
Forecast accuracy is typically measured by comparing forecasted revenue against actual closed revenue for a specific period. Many B2B sales teams track forecast accuracy by forecasting method, sales segment, pipeline, or sales rep to understand which forecasting models produce the most reliable results.
Common Sales Forecasting Mistakes
Even the best sales forecasting methods fail when the underlying process or data quality is weak. Many B2B companies struggle with forecast accuracy not because they use the wrong forecasting model, but because their CRM data, sales discipline, or forecasting process is inconsistent.
The most common sales forecasting mistakes include:
Relying on outdated CRM data
Forecast accuracy drops significantly when sales reps fail to update close dates, deal stages, next steps, or opportunity amounts consistently.
Using one forecasting method for every revenue stream
New business, renewals, upsells, and transactional sales often require different forecasting approaches. Applying the same method across all revenue streams usually reduces forecast reliability.
Ignoring deal slippage
Deals that continuously move to future periods create overly optimistic forecasts and reduce pipeline visibility.
Overestimating late-stage deal probabilities
Many sales teams assume that deals in proposal or negotiation stages are highly likely to close, even when buyer engagement is weak or decision timelines are unclear.
Focusing only on the final forecast number
Strong sales forecasting is not only about predicting revenue. It also helps leaders identify pipeline risk, gaps to target, stalled deals, and areas where the sales process needs improvement.
Failing to measure forecast accuracy
Sales organizations should regularly compare forecasts against actual results to understand which forecasting methods perform best for different sales motions and customer segments.
FAQ
What is the best model for sales forecasting?
There is no single "best" model for sales forecasting - the right choice depends on your sales cycle, data maturity, and business model. For SMBs with short cycles, weighted pipeline forecasting or historical forecasting often works best. Mid-market and enterprise teams usually benefit from AI sales forecasting or multivariable analysis forecasting for more accurate sales forecasts. The most effective approach is often a hybrid, combining human judgment with data-driven sales forecasting methods.
What are the four types of forecasting methods?
The four main types of forecasting methods are: qualitative forecasting (based on expert judgment and rep commits), time series forecasting (analyzing historical sales data over time), causal forecasting (such as regression analysis, linking sales to influencing variables), and AI forecasting models (using machine learning to analyze multiple data signals). Each type of sales forecasting method has its strengths and best-fit scenarios. For example, time series is great for recurring revenue, while AI forecasting is ideal for complex B2B sales cycles. Companies often combine these types for more reliable forecasts.
What are the 7 steps of forecasting?
The 7 steps of sales forecasting typically include:
Define the objective of the forecast.
Collect and clean historical sales data.
Analyze market conditions and external factors.
Select the right sales forecasting method (e.g., weighted pipeline, AI, regression).
Build and run the forecast.
Compare the forecast to actuals and measure forecast accuracy.
Adjust the model and process for future improvements.
Following these steps helps sales leaders build accurate forecasts and improve revenue predictability over time.
Which method is most commonly used in CRM sales forecasting?
The most commonly used approach among sales forecasting methods in CRM systems is the weighted pipeline method. It estimates expected revenue by multiplying each deal value by its stage probability, giving sales leaders a quick and structured forecast. However, most CRMs require teams to assign pipeline stage probabilities manually rather than calculate them automatically from historical data, which often reduces accuracy and introduces bias. That is why many B2B teams increasingly complement this method with data driven or AI based models to improve forecast reliability.
Share:


